 Back
Practice Test 3 – Step-by-Step Guidance for Chemistry Exam Preparation
Study Guide - Smart Notes
 Tailored notes based on your materials, expanded with key definitions, examples, and context.
Q30. Label each of the following titration curves as titration of a …
Background
Topic: Acid-Base Titration Curves
This question tests your ability to interpret titration curves and identify the types of acid-base reactions (strong acid/strong base, weak acid/strong base, weak base/strong acid, etc.) based on the shape and features of the pH vs. volume graph.
Key Terms and Concepts:
Titration Curve: A plot of pH versus volume of titrant added.
Equivalence Point: The point at which stoichiometrically equivalent amounts of acid and base have reacted.
Buffer Region: The region where the solution resists changes in pH, often seen in titrations involving weak acids or bases.
Half-Equivalence Point: The point where half the acid/base has been neutralized; important for weak acid/base titrations.
Step-by-Step Guidance
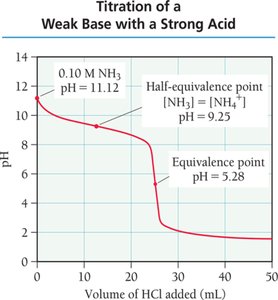
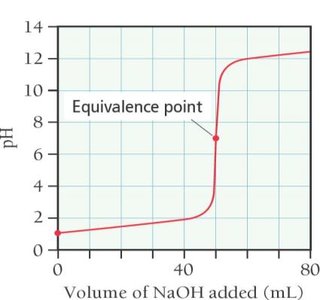
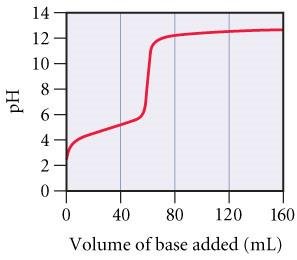
Examine the starting pH of each curve. A high initial pH suggests a base is being titrated, while a low initial pH suggests an acid is being titrated.
Look at the shape of the curve. A sharp rise or fall in pH near the equivalence point is characteristic of strong acid/strong base titrations. A more gradual change and buffer region indicate weak acid or weak base titrations.
Identify the equivalence point pH. For strong acid/strong base titrations, the equivalence point is near pH 7. For weak acid/strong base, it is above 7. For weak base/strong acid, it is below 7.
Compare the volume of titrant added at the equivalence point to the total volume. This can help distinguish between different titration types and concentrations.
Try solving on your own before revealing the answer!
Final Answer:
Image 1: Weak base with strong acid
Image 2: Strong acid with strong base
Image 3: Weak acid with strong base
The identification is based on the initial pH, the buffer region, and the equivalence point pH for each curve.
