 Back
BackL 7.1 Protein Electrophoresis and Molecular Phylogenetics in Fish
Study Guide - Smart Notes
 Tailored notes based on your materials, expanded with key definitions, examples, and context.
L 7.1
Protein Electrophoresis and Molecular Phylogenetics
Introduction to Molecular Phylogenetics
Molecular phylogenetics is the study of evolutionary relationships among organisms using molecular data, such as DNA, RNA, or protein sequences. After speciation, the genomes of separated taxa diverge, and these differences can be used to reconstruct evolutionary histories. Molecular markers are essential tools for delineating clades and understanding phylogenetic descent.
Molecular Clock: The concept that genetic mutations accumulate at a relatively constant rate, allowing estimation of divergence times.
Molecular Systematics: Uses molecular data to infer evolutionary relationships, emphasizing monophyletic groups (clades).
Cladistics: Classification based on common ancestry; valid taxa are monophyletic.
Maximum Parsimony: Prefers the simplest tree with the fewest evolutionary changes.
Maximum Likelihood: Uses statistical models to find the tree most likely to have produced the observed data.
Methods in Molecular Phylogenetics
Several laboratory techniques are used to investigate phylogenies, including protein electrophoresis, immunological assays, DNA restriction analysis, and DNA hybridization. In this lab, protein electrophoresis is used to analyze fish muscle proteins and infer phylogenetic relationships.
Protein Electrophoresis: Separates proteins based on size and charge, allowing comparison of protein profiles among species.
Data Analysis: Protein banding patterns are used to construct a character matrix and generate a cladogram.
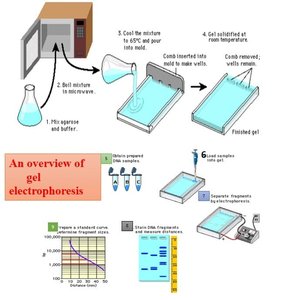
Principles of Gel Electrophoresis
Overview of Gel Electrophoresis
Gel electrophoresis is a technique used to separate macromolecules, such as proteins or nucleic acids, based on their size and charge. In SDS-PAGE (sodium dodecyl sulfate-polyacrylamide gel electrophoresis), proteins are denatured and coated with a negative charge, allowing them to migrate through a polyacrylamide gel matrix when an electric field is applied.
SDS (Sodium Dodecyl Sulfate): A detergent that denatures proteins and imparts a uniform negative charge.
Polyacrylamide Gel: Provides a tight matrix with small pores, ideal for separating proteins by size.
Migration: Smaller proteins move faster through the gel; separation is based on molecular mass.
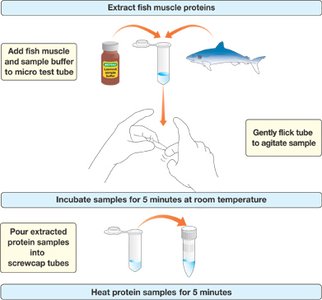
Preparation and Running of SDS-PAGE
The process of SDS-PAGE involves several steps, from protein extraction to gel staining and analysis.
Sample Preparation: Fish muscle is homogenized with sample buffer containing Tris buffer, glycerol, bromophenol blue, and SDS.
Denaturation: Samples are heated to denature proteins.
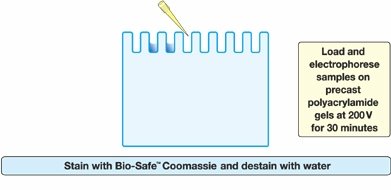
Loading and Electrophoresis: Samples are loaded into wells of a polyacrylamide gel and subjected to an electric field.
Staining: Gels are stained (e.g., with Coomassie Blue) to visualize protein bands.
Protein Separation and Analysis
Why Use Polyacrylamide Gels?
Polyacrylamide gels are preferred for protein separation due to their small pore size, which allows for effective resolution of proteins that are much smaller than DNA molecules. Agarose gels, with larger pores, are more suitable for DNA separation.
Average Protein Size: Amino acid = 110 Daltons; proteins range from a few kD to several thousand kD.
Comparison: One kilobase of DNA = 650 kD; encodes about 333 amino acids (36 kD).
Fish Muscle Proteins
Fish muscle contains a variety of proteins with different molecular masses and functions. These proteins can be separated and identified using SDS-PAGE.
Protein | Molecular Mass (kD) | Function |
|---|---|---|
Titin | 3000 | Centers myosin in sarcomere |
Dystrophin | 400 | Anchoring to plasma membrane |
Filamin | 270 | Cross-link filaments |
Myosin heavy chain | 210 | Slide filaments |
Spectrin | 265 | Attach filaments to plasma membrane |
Nebulin | 107 | Regulate actin assembly |
α-actinin | 100 | Bundle filaments |
Gelosin | 90 | Fragment filaments |
Fimbrin | 68 | Bundle filaments |
Actin | 42 | Form filaments |
Tropomyosin | 35 | Strengthen filaments |
Myosin light chain | 15-25 | Slide filaments |
Troponin (T.I.C.) | 30, 19, 17 | Mediate contraction |
Thymosin | 5 | Sequester actin monomers |
Analysis of Protein Bands
After electrophoresis, the migration distance of each protein band is measured. The molecular mass of unknown proteins can be determined by comparing their migration to a standard curve generated from proteins of known size.
Semi-log Graph Paper: Used to plot migration distance (linear axis) versus log of molecular mass (logarithmic axis).
Standard Curve: Allows estimation of protein size based on migration distance.

Constructing a Character Matrix and Cladogram
Character Matrix
A character matrix is constructed by recording the presence or absence of protein bands (at specific migration distances) for each species. This matrix is used to infer evolutionary relationships.
Distance Migrated (mm) | Species 1 | Species 2 | Species 3 | Species 4 | Species 5 |
|---|---|---|---|---|---|
... | X | X | X | ||
... | X | X | X |
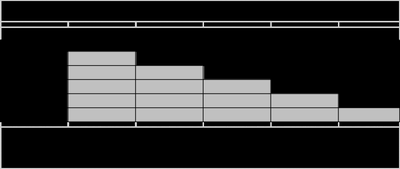
Cladogram Construction
The character matrix is analyzed using principles of parsimony or likelihood to construct a cladogram, a branching diagram that represents the hypothesized evolutionary relationships among the species based on their protein profiles.
Monophyletic Groups: Clades that include an ancestor and all its descendants.
Outgroup Comparison: Used to root the tree and infer ancestral states.
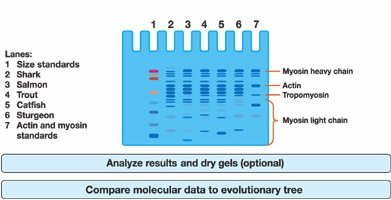
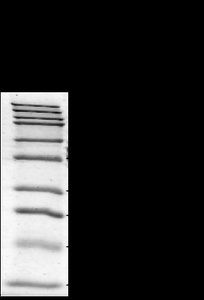
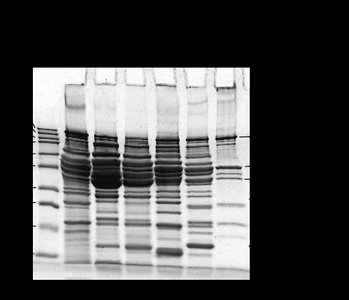
Example: Fish Protein Electrophoresis Gel
The SDS-PAGE gel image below shows the protein banding patterns for several fish species. These patterns are used to generate the character matrix and infer phylogenetic relationships.
Summary
Molecular phylogenetics uses protein and DNA data to reconstruct evolutionary relationships.
SDS-PAGE is a powerful tool for separating proteins by size and comparing protein profiles among species.
Protein banding patterns are used to construct character matrices and cladograms, revealing evolutionary histories.
Additional info: The lab exercise described here aligns with topics in molecular systematics, protein structure and function, and phylogenetic analysis, as covered in college-level biology courses (e.g., Ch. 5, Ch. 20, Ch. 26).
