 Back
Scientific Inquiry and Experimental Design in Biology
Study Guide - Smart Notes
 Tailored notes based on your materials, expanded with key definitions, examples, and context.
Lab Topic 1: Scientific Inquiry
Introduction to Scientific Inquiry
Scientific inquiry is the systematic process by which scientists investigate natural phenomena, ask questions, and seek evidence-based answers. The process is foundational to all biological research and underpins the development of scientific knowledge.
Science is the pursuit of understanding the natural world through observation, experimentation, and reasoning.
Scientific questions must be testable, measurable, and controllable.
Science cannot address questions outside the realm of natural phenomena (e.g., supernatural or moral questions).
The Scientific Method
The scientific method is a logical sequence of steps used to investigate questions and test hypotheses. It is iterative and self-correcting, allowing for refinement of ideas based on evidence.
Observation: Noticing phenomena or patterns in the natural world.
Question: Formulating a question based on observations.
Hypothesis: Proposing a testable and falsifiable explanation for the observation.
Prediction: Making an "if...then..." statement about the expected outcome if the hypothesis is correct.
Experiment: Designing and conducting a controlled test of the hypothesis.
Data Collection: Gathering and recording observations or measurements.
Conclusion: Interpreting results to support or refute the hypothesis.
Communication: Sharing findings with the scientific community for peer review.
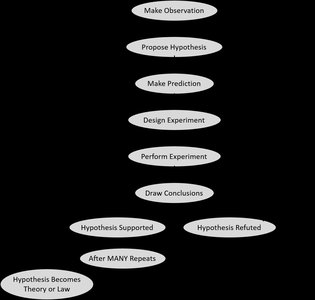
Additional info: If a hypothesis is repeatedly supported by evidence, it may become a scientific theory or law.
Formulating Hypotheses
A hypothesis is a tentative explanation for an observation, which must be testable and falsifiable. It is never proven, only supported or refuted by evidence.
Example: "Spines on a cactus prevent animals from eating it."
If evidence contradicts the hypothesis, it is rejected or revised.
Multiple hypotheses may be tested to explain a phenomenon.
Designing Experiments
Experiments are structured to test hypotheses by manipulating variables and observing outcomes. Key components include:
Independent Variable: The factor that is changed or manipulated (e.g., sulfur dioxide concentration).
Dependent Variable: The factor that is measured (e.g., number of bean pods, seeds per pod, mass of pods).
Controlled Variables: Factors kept constant to ensure a fair test (e.g., light, temperature, water, soil type).
Control Group: The group not exposed to the independent variable, used as a baseline for comparison.
Experimental Group: The group exposed to the independent variable.
Replication: Repeating the experiment multiple times to ensure reliability and account for variability.
Making Predictions
Predictions are specific statements about the expected outcome of an experiment, based on the hypothesis. They are typically written as "if...then..." statements.
Example: "If soybean plants are exposed to sulfur dioxide, then their reproductive success will decrease."
Presenting Results: Tables and Graphs
Data from experiments are organized in tables and visualized in graphs to facilitate interpretation and communication.
Bar Graphs: Used for discrete categories of the independent variable.
Line Graphs: Used for continuous variables.
The x-axis represents the independent variable; the y-axis represents the dependent variable.
Graphs should include labeled axes, units, a descriptive title, and a legend if necessary.
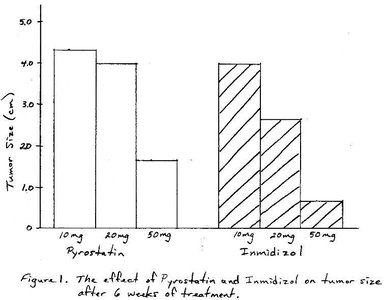
Figure 1: Example of a bar graph showing the effect of two drugs (Pyrostatin and Imnidizol) on tumor size after 6 weeks of treatment.
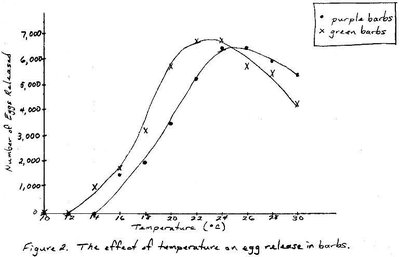
Figure 2: Example of a line graph showing the effect of temperature on egg release in two types of barbs.
Interpreting and Communicating Results
After data analysis, scientists interpret whether the results support or refute the hypothesis. Conclusions are communicated through presentations, reports, and peer-reviewed publications. Science is self-correcting, as findings are scrutinized and replicated by others.
If the hypothesis is supported, further experiments may be conducted to strengthen the evidence.
If the hypothesis is refuted, alternative explanations are proposed and tested.
A hypothesis that withstands repeated testing may become a theory.
Exercise: Experimental Design with Maple Samaras
Seed Dispersal in Plants
Plants disperse their seeds to reduce competition and colonize new habitats. Maple trees produce winged fruits called samaras that use wind for dispersal. The descent rate of samaras affects how far they travel from the parent plant.
Descent Rate: The speed at which a samara falls, measured in meters per second (m/s).
Wing Length: Longer wings generally slow descent, increasing dispersal distance.
Experimental Procedure
Drop samaras from a fixed height and measure descent time.
Calculate descent rate:
Test the effect of wing length by progressively shortening the wing and measuring descent rate.
Sample Data Table: Effect of Wing Length on Descent Rate
Wing Length Ratio | Descent Time (s) | Descent Rate (m/s) |
|---|---|---|
1.0 | 1.93, 1.21, 1.15 | 1.80 |
0.75 | 1.34, 1.29, 1.53 | 1.38 |
0.5 | 1.63, 1.38, 1.21 | 1.33 |
0.25 | 1.05, 1.04, 1.65 | 1.44 |
Additional info: As wing length decreases, descent rate increases, and the samara's ability to "fly" or disperse decreases.
Summary of Findings
Longer samara wings result in slower descent rates, allowing seeds to disperse farther from the parent plant.
Shorter wings increase descent rate, reducing dispersal distance and effectiveness.
This demonstrates a tradeoff between seed size and dispersal ability in plant reproductive strategies.
Key Terms and Concepts
Hypothesis: A testable, falsifiable explanation for an observation.
Independent Variable: The factor manipulated in an experiment.
Dependent Variable: The factor measured in response to changes in the independent variable.
Controlled Variables: Factors kept constant to ensure a fair test.
Replication: Repeating experiments to ensure reliability.
Descent Rate: The speed at which an object falls, calculated as
References
Carey, S.S. (2004). A Beginner’s Guide to Scientific Method. 3rd ed. Thomson/ Wadsworth Publishers, Belmont, CA.
Morgan, J.G., Carter, M., & Brown, E. (2004). Investigating Biology. Pearson Custom Publishers, San Francisco.
