Back
BackL13 Statistics and Experimental Design in Biology: Central Tendency, Dispersion, and Inferential Tests
Study Guide - Smart Notes
 Tailored notes based on your materials, expanded with key definitions, examples, and context.
Statistics in Biological Research
Experimental Design and Hypothesis Testing
Statistical analysis is fundamental in biological research for designing experiments, testing hypotheses, and interpreting data. The scientific method guides experimental design, where hypotheses are formulated and tested using statistical tools.
Null Hypothesis (H0): States that there is no effect of variable A on variable B (e.g., no effect of caffeine on heart rate in mice).
Alternate Hypothesis (H1): States that there is an effect of variable A on variable B (e.g., caffeine impacts heart rate in mice).
Statistical results determine whether to accept or reject the null hypothesis.
Populations, Samples, and Variables
Understanding the difference between populations and samples is crucial for statistical inference in biology.
Population: All values of a specified group (e.g., heights of all students in BIO192).
Sample: A subset of the population used for analysis.
Types of Variables
Continuous Variables: Quantitative, numeric, can take any value within a range (e.g., height, speed).
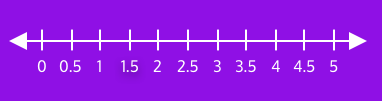
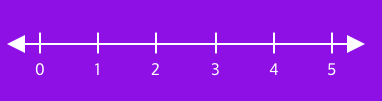
Discrete Variables: Quantitative, numeric, only specific values are possible (e.g., number of students).
Categorical Variables: Non-numeric, can be nominal (no order) or ordinal (ordered categories).
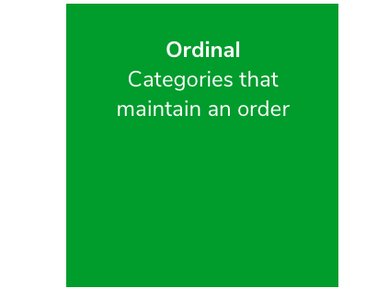
Ordinal: Categories that maintain an order (e.g., ranking in a competition).
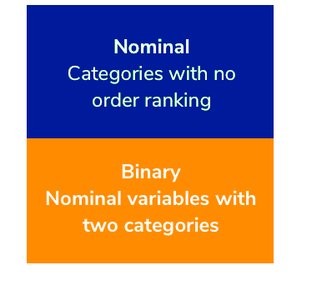
Nominal: Categories with no order ranking (e.g., hair color, marital status).
Descriptive Statistics: Central Tendency and Dispersion
Measures of Central Tendency
Central tendency describes the center of a data distribution. The main measures are mean, median, and mode.
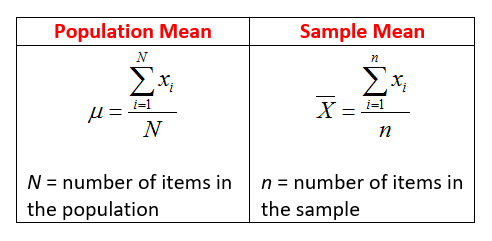
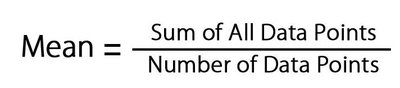
Mean: The average value.
Population Mean (μ):
Sample Mean (\bar{x}):
Median: The middle value when data are ordered. Useful for skewed distributions or outlier data.
Median position:
Mode: The value that appears most frequently. Useful for skewed distributions.
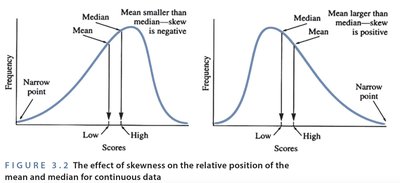
Skewness and Central Tendency
Skewness affects the relationship between mean, median, and mode. In left-skewed distributions, the mean is less than the median; in right-skewed, the mean is greater than the median.
Measures of Dispersion
Dispersion quantifies the spread of data values.
Range: Difference between the highest and lowest values.
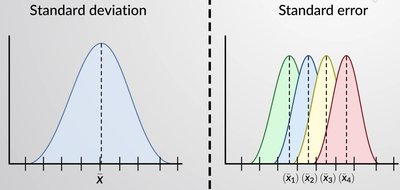
Standard Deviation (SD): Measures variability from the mean.
Population SD (σ):
Sample SD (s):
Standard Error of the Mean (SEM): Estimates the uncertainty in the sample mean.
When to Use SD vs SEM
SD: Describes variability within a single dataset.
SEM: Estimates how much the sample mean is likely to differ from the true population mean.
Sample Size and Random Sampling
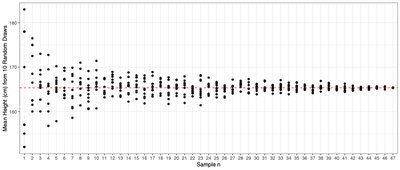
Sample size affects the accuracy and precision of statistical estimates. Larger samples provide better approximations of the population mean but may be costly or impractical.
Small samples may not be representative and are prone to sampling error.
As sample size increases, SEM decreases, and the sample mean approaches the true population mean.
Inferential Statistics: Hypothesis Testing and t-Tests
Types of Inferential Tests
Inferential statistics allow biologists to make conclusions about populations based on sample data. Common tests include:
T-test: Compares means between groups. Types include one-sample, independent-samples, and paired-samples t-tests.
Correlation and Regression: Assess relationships between variables.
Two-Sample t-Test (Independent Samples)
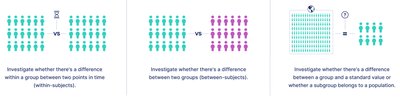
Used to compare the means of two independent groups (e.g., control vs. experimental).
Test Statistic:
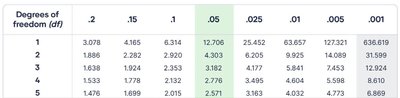
Degrees of Freedom:
P-value: Probability of obtaining the observed result under the null hypothesis.
P < 0.05: Difference is unlikely due to chance (statistically significant).
P > 0.05: Difference could be due to chance (not significant).
Other t-Tests
Paired Samples t-Test: Compares means within a group at two points in time (e.g., before and after treatment).
One Sample t-Test: Compares a sample mean to a known value or population mean.
Summary Table: Central Tendency and Dispersion
Measure | Formula | Purpose |
|---|---|---|
Mean | Average value | |
Median | Middle value | Robust to outliers/skew |
Mode | Most frequent value | Useful for categorical/skewed data |
Range | Spread of values | |
Standard Deviation | Variability from mean | |
Standard Error | Uncertainty in mean estimate |
Recap and Applications in Biology
Statistical methods are essential for analyzing biological data, testing hypotheses, and drawing conclusions about populations.
Choosing the correct measure of central tendency and dispersion depends on data distribution and research question.
Inferential tests such as t-tests allow comparison between groups and assessment of experimental effects.
Example Application: Measuring body mass of newts in a vernal pool and comparing before/after treatment or between groups using appropriate t-tests.