 Back
BackStep-by-Step Guidance for Enzyme and Metabolism Questions
Study Guide - Smart Notes
 Tailored notes based on your materials, expanded with key definitions, examples, and context.
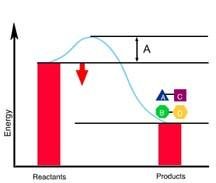
Q1. What is the correct label for "A" in the energy diagram?
Background
Topic: Enzyme Catalysis and Activation Energy
This question is testing your understanding of how enzymes affect the energy profile of a chemical reaction, specifically the concept of activation energy.
Key Terms and Formulas:
Activation Energy (EA): The minimum energy required to start a chemical reaction.
Enzyme: A biological catalyst that speeds up reactions by lowering the activation energy.
Step-by-Step Guidance
Examine the energy diagram. Notice the curve that rises from reactants to products, with a peak labeled "A".
Identify what "A" represents: It is the difference in energy between the reactants and the highest point on the curve (the transition state).
Recall that the activation energy is the energy barrier that must be overcome for reactants to become products.
Enzymes lower this energy barrier, making reactions proceed faster.
Try solving on your own before revealing the answer!
Final Answer: Activation Energy (EA)
"A" is the activation energy, which is the energy required to initiate the reaction.
Enzymes lower this value, allowing reactions to proceed more quickly.
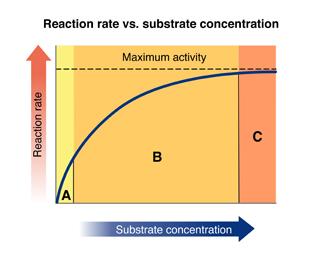
Q2. In which region does the reaction rate remain constant on the reaction rate vs. substrate concentration graph?
Background
Topic: Enzyme Kinetics
This question is about how substrate concentration affects the rate of an enzyme-catalyzed reaction, and what happens when the enzyme becomes saturated.
Key Terms and Formulas:
Enzyme Saturation: The point at which all enzyme active sites are occupied by substrate.
Reaction Rate: The speed at which product is formed.
Step-by-Step Guidance
Look at the graph, which plots reaction rate against substrate concentration.
Identify the regions: Region A (low substrate), Region B (increasing rate), Region C (plateau).
Recall that when the enzyme is saturated, adding more substrate does not increase the reaction rate.
The region where the rate remains constant is where the enzyme is saturated.
Try solving on your own before revealing the answer!
Final Answer: Region C
Region C is where the reaction rate remains constant because the enzyme is saturated with substrate.
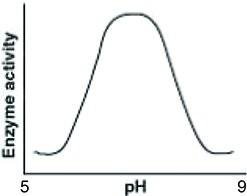
Q3. Which graph best reflects the activity profile of catalase from pH 5 to pH 9?
Background
Topic: Enzyme Activity and pH Dependence
This question tests your understanding of how enzyme activity changes with pH, specifically for catalase, which works best at neutral pH.
Key Terms and Formulas:
Enzyme Activity: The rate at which an enzyme catalyzes a reaction.
Optimum pH: The pH at which an enzyme's activity is highest.
Step-by-Step Guidance
Examine the graph showing enzyme activity versus pH.
Notice the peak in activity around pH 7, which is neutral.
Understand that catalase is most active at neutral pH, and activity decreases at more acidic or basic pH values.
Relate this to the environment of human liver cells, which is approximately neutral.
Try solving on your own before revealing the answer!
Final Answer: The graph with a peak at neutral pH
This graph best reflects catalase activity, showing maximum activity at pH 7.
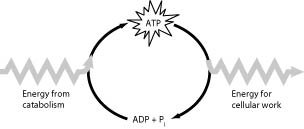
Q4. What is the central role that ATP plays in cellular metabolism?
Background
Topic: ATP and Energy Coupling
This question is about how ATP acts as an energy carrier, linking catabolic and anabolic pathways in the cell.
Key Terms and Formulas:
ATP (Adenosine Triphosphate): The main energy currency of the cell.
Energy Coupling: The use of energy from exergonic reactions to drive endergonic reactions.
(hydrolysis releases energy)
Step-by-Step Guidance
Recall that catabolic pathways release energy, which is stored in ATP.
ATP hydrolysis provides energy for cellular work and anabolic reactions.
ATP acts as an intermediary, coupling energy release and energy consumption.
Understand that ATP is regenerated from ADP and during catabolic reactions.
Try solving on your own before revealing the answer!
Final Answer: ATP provides energy coupling between exergonic and endergonic reactions.
ATP stores energy from catabolic reactions and releases it for cellular work and anabolic reactions.
