 Back
Step-by-Step Study Guidance for General Biology Exam Practice
Study Guide - Smart Notes
 Tailored notes based on your materials, expanded with key definitions, examples, and context.
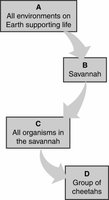
Q1. Which level in the hierarchy shown is a community?
Background
Topic: Levels of Biological Organization
This question tests your understanding of the hierarchy of life, specifically the distinction between biosphere, ecosystem, community, and population.
Key Terms:
Biosphere: All environments on Earth supporting life.
Ecosystem: All living and nonliving things in a particular area.
Community: All organisms in a particular area.
Population: All individuals of a species in a specific area.
Step-by-Step Guidance
Examine each level in the diagram: A (biosphere), B (ecosystem), C (community), D (population).
Recall that a community includes all living organisms in a specific area, regardless of species.
Compare this to a population, which is only one species, and an ecosystem, which includes both living and nonliving components.
Identify which box in the diagram represents all organisms in the savannah.
Try solving on your own before revealing the answer!
Final Answer: C (All organisms in the savannah)
Box C represents the community level, which includes all living organisms in the savannah.
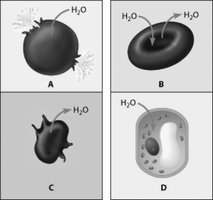
Q2. Which figure depicts an animal cell placed in a solution hypotonic to the cell?
Background
Topic: Osmosis and Cell Tonicity
This question tests your understanding of how animal and plant cells respond to hypotonic, isotonic, and hypertonic solutions.
Key Terms:
Hypotonic solution: Lower solute concentration outside the cell, causing water to enter the cell.
Lysis: Bursting of a cell due to excess water intake.
Turgid: Swollen state of a plant cell in a hypotonic solution.
Step-by-Step Guidance
Review the images for signs of water movement into or out of the cells.
Recall that animal cells in hypotonic solutions will swell and may burst (lyse).
Identify which image shows an animal cell bulging and lysing due to water intake.
Compare the plant cell's response to hypotonic solutions (turgid, not lysed).
Try solving on your own before revealing the answer!
Final Answer: A (cell A)
Cell A shows an animal cell lysing, which occurs in a hypotonic solution.
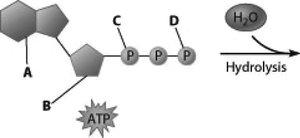
Q3. Which part of the ATP molecule breaks free of the rest when an ATP molecule releases energy?
Background
Topic: ATP Structure and Function
This question tests your understanding of how ATP releases energy through hydrolysis.
Key Terms and Formula:
ATP (Adenosine Triphosphate): The cell's main energy currency.
Hydrolysis: The process of breaking a bond using water.
Phosphate group: The part of ATP that is released to provide energy.
Step-by-Step Guidance
Identify the three phosphate groups in the ATP molecule (labeled C and D).
Recall that energy is released when the terminal (last) phosphate group is removed.
Locate the terminal phosphate group in the diagram.
Understand that hydrolysis breaks the bond between the second and third phosphate groups.
Try solving on your own before revealing the answer!
Final Answer: D (part D)
The terminal phosphate group (D) breaks free during ATP hydrolysis, releasing energy.
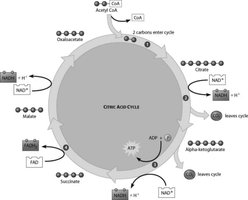
Q4. What step of the citric acid cycle requires both NAD+ and ADP as reactants?
Background
Topic: Citric Acid Cycle (Krebs Cycle)
This question tests your ability to interpret a diagram of the citric acid cycle and identify where NAD+ and ADP are used.
Key Terms:
NAD+: Electron carrier involved in redox reactions.
ADP: Adenosine diphosphate, converted to ATP during the cycle.
Citric Acid Cycle: Series of reactions generating energy via oxidation of acetyl CoA.
Step-by-Step Guidance
Examine the diagram for steps where NAD+ and ADP are both shown as reactants.
Recall that NAD+ is reduced to NADH and ADP is phosphorylated to ATP.
Identify the step where both NAD+ and ADP enter the reaction together.
Note the products formed in this step (NADH and ATP).
Try solving on your own before revealing the answer!
Final Answer: Step 3
Step 3 of the citric acid cycle requires both NAD+ and ADP as reactants, producing NADH and ATP.
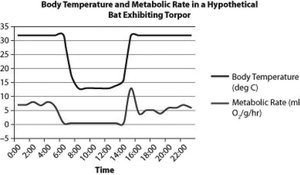
Q5. Based on the graph, what is the relationship between metabolic rate and body temperature in a hypothetical bat exhibiting torpor?
Background
Topic: Metabolism and Thermoregulation
This question tests your ability to interpret a graph showing body temperature and metabolic rate over time in an animal experiencing torpor.
Key Terms:
Metabolic rate: The rate at which an organism uses energy.
Body temperature: The internal temperature of the organism.
Torpor: A state of decreased physiological activity.
Step-by-Step Guidance
Examine the graph for periods when metabolic rate and body temperature change.
Identify the time intervals when both variables decrease.
Observe whether the changes in metabolic rate correspond to changes in body temperature.
Consider the physiological reasons for this relationship during torpor.
Try solving on your own before revealing the answer!
Final Answer: When metabolic rate drops, so does body temperature.
The graph shows that both metabolic rate and body temperature decrease during torpor.
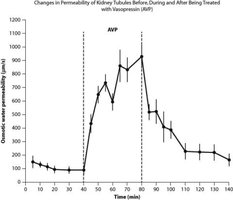
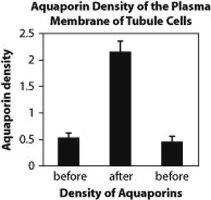
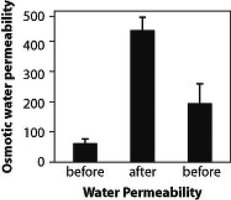
Q6. How does vasopressin affect water permeability and aquaporin density in kidney tubule cells?
Background
Topic: Hormonal Regulation of Kidney Function
This question tests your understanding of how the hormone vasopressin (AVP) regulates water permeability and aquaporin density in kidney tubules.
Key Terms:
Vasopressin (AVP): Hormone that increases water reabsorption in kidneys.
Aquaporins: Water channel proteins in cell membranes.
Water permeability: The ability of water to move across cell membranes.
Step-by-Step Guidance
Examine the graphs for changes in water permeability and aquaporin density before, during, and after vasopressin administration.
Note the increase in both water permeability and aquaporin density during vasopressin treatment.
Understand that aquaporins facilitate water movement across membranes.
Relate the increase in aquaporin density to the increase in water permeability.
Try solving on your own before revealing the answer!
Final Answer: Vasopressin increases both water permeability and aquaporin density in kidney tubule cells.
During vasopressin treatment, both water permeability and aquaporin density rise, enhancing water reabsorption.
