 Back
BackStudy Guide: Population Dynamics and Trophic Cascades in Ecology
Study Guide - Smart Notes
 Tailored notes based on your materials, expanded with key definitions, examples, and context.
Q1. List at least five factors that may limit the size and growth of animal populations in the Serengeti. Label each as density-dependent or density-independent.
Background
Topic: Population Regulation
This question tests your understanding of how populations are regulated by different environmental and biological factors. These factors can be classified as density-dependent (affected by population size) or density-independent (not affected by population size).
Key Terms:
Density-dependent factors: Effects increase as population size increases (e.g., competition, predation).
Density-independent factors: Effects are unrelated to population size (e.g., weather, natural disasters).
Step-by-Step Guidance
Think about biotic factors (living) such as food availability, predation, disease, and competition. These often depend on how many individuals are present.
Consider abiotic factors (non-living) like drought, floods, fires, or temperature extremes. These typically affect populations regardless of their size.
For each factor you list, decide if it is density-dependent or density-independent based on whether its impact changes with population size.
Fill out the table with your predictions, making sure to justify your reasoning for each classification.
Try solving on your own before revealing the answer!
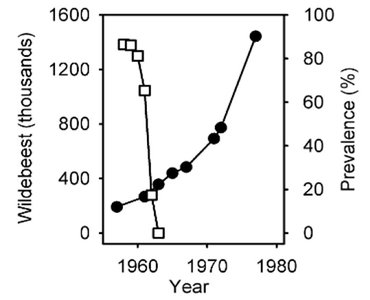
Q2. In Figure 1, which symbol represents the number of wildebeest, and which represents the percentage of wildebeest with rinderpest? How do you know?
Background
Topic: Data Interpretation in Population Ecology
This question tests your ability to interpret scientific graphs and distinguish between different data series.
Key Terms:
Prevalence: The percentage of individuals in a population affected by a particular factor (e.g., disease).
Population size: The total number of individuals in a population.
Step-by-Step Guidance
Examine the axes of Figure 1: one axis shows wildebeest numbers (in thousands), the other shows prevalence (%).
Look at the symbols used in the graph (unshaded squares and shaded circles) and see which data series matches each axis.
Compare the trends: does the symbol that decreases over time match the prevalence axis, or the population axis?
Use the legend or context clues to confirm your interpretation.
Try solving on your own before revealing the answer!
Q3. The elimination of rinderpest impacted the wildebeest population. What type of factor is rinderpest (density-dependent or independent)? Explain.
Background
Topic: Disease as a Population Regulator
This question asks you to classify rinderpest as a density-dependent or density-independent factor and explain your reasoning.
Key Terms:
Density-dependent factor: Impact increases with population size.
Density-independent factor: Impact does not depend on population size.
Step-by-Step Guidance
Consider how diseases like rinderpest spread—do they become more severe as population density increases?
Think about whether the effect of rinderpest would be the same regardless of population size.
Use your understanding of disease transmission to classify rinderpest.
Explain your reasoning based on the definition of density-dependent and density-independent factors.
Try solving on your own before revealing the answer!
Q4. Consider the growth curve of the wildebeest population shown in Figure 1. Which of the following best describes this type of growth: exponential, linear, or logistic?
Background
Topic: Population Growth Models
This question tests your ability to recognize different types of population growth curves.
Key Terms and Formulas:
Exponential growth:
Logistic growth:
Linear growth: Population increases at a constant rate.
Step-by-Step Guidance
Examine the shape of the curve in Figure 1: does it show rapid increase, leveling off, or a straight line?
Recall the characteristics of each growth model: exponential (J-shaped), logistic (S-shaped), linear (straight line).
Match the observed curve to the correct model based on its features.
Justify your choice using the definitions and formulas above.
Try solving on your own before revealing the answer!
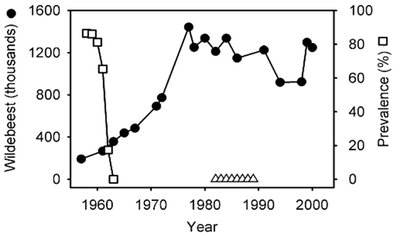
Q5. Consider the entire growth curve for the wildebeest population shown in Figure 2. Which of the following best describes this type of growth: exponential, linear, or logistic?
Background
Topic: Long-Term Population Growth
This question asks you to interpret a population growth curve over a longer time period and identify the growth model.
Key Terms and Formulas:
Exponential growth:
Logistic growth:
Carrying capacity (): Maximum population size the environment can support.
Step-by-Step Guidance
Look at Figure 2 and observe whether the population levels off after a period of rapid growth.
Recall that logistic growth is characterized by an S-shaped curve, with population stabilizing near carrying capacity.
Compare the curve to the definitions and formulas for exponential and logistic growth.
Use the data to justify your answer.
Try solving on your own before revealing the answer!
Q6. Which factors may have limited the growth rate of the wildebeest population from around 1980 to 2000? Were these factors likely to be density-dependent or density-independent? Why?
Background
Topic: Limiting Factors in Population Growth
This question tests your ability to identify and classify factors that limit population growth, especially after a population reaches carrying capacity.
Key Terms:
Limiting factors: Environmental or biological factors that restrict population growth.
Density-dependent: Effects increase with population size (e.g., competition, predation).
Density-independent: Effects are unrelated to population size (e.g., drought, disease outbreaks).
Step-by-Step Guidance
Examine the plateau in the population curve from 1980 to 2000 in Figure 2.
Consider what factors could cause population growth to slow or stabilize (e.g., food, space, predation).
Decide if these factors are density-dependent or density-independent based on their relationship to population size.
Justify your reasoning using ecological principles.
Try solving on your own before revealing the answer!
Q7. Based on Figure 2, what is the wildebeest population’s approximate carrying capacity?
Background
Topic: Carrying Capacity in Population Ecology
This question asks you to estimate the carrying capacity () from a population growth curve.
Key Terms:
Carrying capacity (): The maximum population size that the environment can sustain.
Step-by-Step Guidance
Look at the plateau in the population curve in Figure 2, where the population size stabilizes.
Identify the approximate value on the y-axis where the population remains steady.
Use this value as your estimate for carrying capacity.
Try solving on your own before revealing the answer!
Q8. In a similarly-sized population that is being sustainably harvested for human use, what is the population size (N) that would produce the largest sustainable annual harvest? And what would the annual harvest amount at that population size be? Use the formula . Assume . Show your calculations.
Background
Topic: Sustainable Harvest and Population Growth
This question tests your ability to apply the logistic growth formula to determine the maximum sustainable yield.
Key Formula:
Where:
= population growth rate (annual harvest)
= per capita rate of increase (0.02)
= population size
= carrying capacity
Step-by-Step Guidance
Recall that the largest sustainable harvest occurs when .
Plug and into the formula .
Set up the calculation for using the estimated carrying capacity from Q7.
Stop before plugging in the final values and calculating the result.
Try solving on your own before revealing the answer!
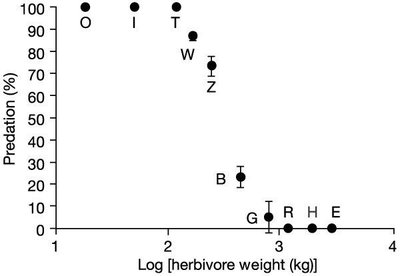
Q9. Approximately what percentage of nonmigratory wildebeest deaths are caused by predation?
Background
Topic: Predation and Mortality in Herbivore Populations
This question tests your ability to interpret a graph showing the relationship between predation and herbivore weight.
Key Terms:
Predation: The act of one organism consuming another.
Mortality: The rate of death in a population.
Step-by-Step Guidance
Locate the data point for wildebeest (W) on the graph.
Read the corresponding predation percentage from the y-axis.
Compare this value to the answer choices provided.
Try solving on your own before revealing the answer!
Q10. Is predation density-dependent or density-independent? Explain.
Background
Topic: Classification of Limiting Factors
This question asks you to classify predation as density-dependent or density-independent and explain your reasoning.
Key Terms:
Density-dependent: Effects increase with population size.
Density-independent: Effects are unrelated to population size.
Step-by-Step Guidance
Consider how predation rates change as population density increases.
Think about whether predators are more likely to find prey in larger populations.
Use ecological principles to justify your classification.
Try solving on your own before revealing the answer!
Q11. How and why are the factors limiting migratory wildebeest populations different than those limiting nonmigratory wildebeest populations?
Background
Topic: Population Regulation in Different Ecological Contexts
This question tests your understanding of how migration affects exposure to limiting factors.
Key Terms:
Migratory: Moving seasonally between regions.
Nonmigratory: Staying in one place year-round.
Step-by-Step Guidance
Consider the risks and resources available to migratory vs. nonmigratory populations.
Think about how migration might reduce predation or increase access to food.
Compare the main causes of mortality for each group.
Explain why these differences exist based on ecological principles.
Try solving on your own before revealing the answer!
Q12. What might explain the relationship between predation and herbivore weight shown in Figure 3?
Background
Topic: Predator-Prey Dynamics
This question asks you to interpret the relationship between body size and predation risk.
Key Terms:
Predation risk: Likelihood of being preyed upon.
Herbivore weight: Body mass of herbivores.
Step-by-Step Guidance
Observe the trend in Figure 3: does predation percentage increase or decrease with herbivore weight?
Think about why larger animals might be less vulnerable to predation.
Use ecological reasoning to explain the observed relationship.
Try solving on your own before revealing the answer!
