 Back
BackSystems Ecology: Energy Flow and Nutrient Cycling Study Guide
Study Guide - Smart Notes
 Tailored notes based on your materials, expanded with key definitions, examples, and context.
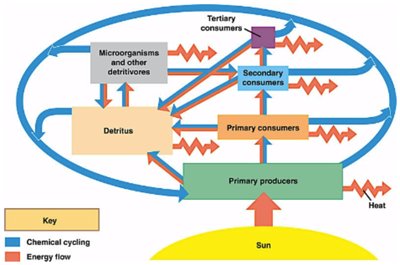
Q1. Explain why a constant input of energy into an ecosystem is necessary and how energy flows through and exits from an ecosystem.
Background
Topic: Energy Flow in Ecosystems
This question tests your understanding of how energy enters, moves through, and leaves ecosystems, and why ecosystems require a continual energy supply.
Key Terms and Concepts:
Energy flow: The movement of energy through trophic levels in an ecosystem, from primary producers to various consumers and eventually lost as heat.
2nd Law of Thermodynamics: Energy transformations are inefficient; some energy is always lost as heat.
Primary producers: Organisms (like plants) that convert solar energy into chemical energy via photosynthesis.
Step-by-Step Guidance
Start by considering the source of energy for most ecosystems: the sun. Primary producers capture solar energy and convert it into chemical energy.
As energy moves from producers to consumers (herbivores, then carnivores), some energy is transferred, but much is lost as heat at each step due to metabolic processes.
Because energy is lost at each trophic level, a constant input (from the sun) is necessary to sustain the ecosystem's energy needs.
Think about how energy eventually exits the ecosystem as heat, which cannot be recycled by living organisms.
Try solving on your own before revealing the answer!
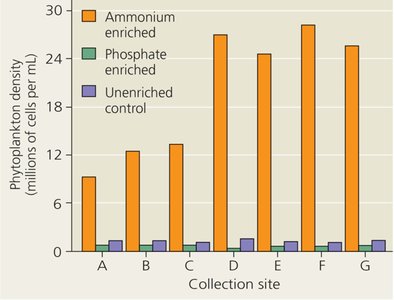
Q2. What is the concept of a "limiting nutrient" and how can ecologists experimentally determine the limiting nutrient in an aquatic ecosystem?
Background
Topic: Limiting Nutrients in Ecosystems
This question focuses on nutrient limitation and experimental approaches to identify which nutrient restricts primary production in aquatic systems.
Key Terms and Concepts:
Limiting nutrient: The nutrient in shortest supply relative to demand, limiting the growth of organisms.
Experimental enrichment: Adding nutrients to water samples to see which addition increases primary production (e.g., phytoplankton growth).
Step-by-Step Guidance
Understand that primary production in aquatic systems can be limited by the availability of certain nutrients, often nitrogen or phosphorus.
Ecologists test for limiting nutrients by adding different nutrients (e.g., ammonium, phosphate) to water samples and measuring the response (such as phytoplankton density).
Compare the growth in enriched samples to control samples to determine which nutrient addition causes the greatest increase in growth.
Interpret experimental data to identify the limiting nutrient based on which treatment shows the largest effect.
Try solving on your own before revealing the answer!
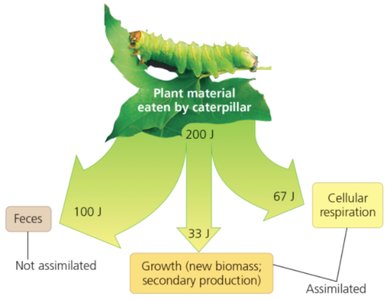
Q12. Explain what "production efficiency" is. What’s the production efficiency of the caterpillar in the figure below? And if a different caterpillar ate 300 J, eliminated 150 J as feces, and used 100 J for cellular respiration, what would its production efficiency be?
Background
Topic: Production Efficiency in Ecosystems
This question tests your understanding of how efficiently organisms convert assimilated energy into new biomass (growth).
Key Terms and Formulas:
Production efficiency: The percentage of assimilated energy that is converted into new biomass.
Key formula:
Net secondary production: Energy used for growth (new biomass).
Assimilated energy: Energy taken in minus energy lost as feces.
Step-by-Step Guidance
Identify the total energy consumed, energy lost as feces, and energy used for respiration from the diagram or data.
Calculate assimilated energy:
Determine the energy used for growth (net secondary production).
Set up the production efficiency formula using the values from the previous steps.
Try solving on your own before revealing the answer!
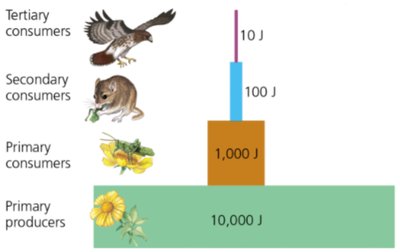
Q14. Use the diagram below to explain trophic efficiency.
Background
Topic: Trophic Efficiency and Energy Pyramids
This question asks you to interpret an energy pyramid and explain how energy transfer between trophic levels shapes ecosystem structure.
Key Terms and Concepts:
Trophic efficiency: The percentage of production transferred from one trophic level to the next.
Energy pyramid: A graphical representation showing the energy available at each trophic level.
Step-by-Step Guidance
Observe the energy values at each trophic level in the diagram (e.g., primary producers, primary consumers, etc.).
Note how energy decreases at each successive level, typically by about 10% transfer efficiency.
Explain why energy is lost at each step (e.g., as heat, through respiration, or waste).
Relate this loss to the shape of the pyramid and the limited number of trophic levels in most ecosystems.
Try solving on your own before revealing the answer!
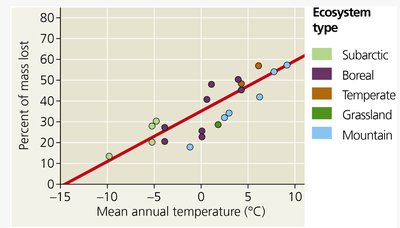
Q16. The figure below shows the percent of leaf litter lost from decomposition over three years in different sites across Canada. Given this figure, what can you infer about the relationship between rate of decomposition and the mean annual temperature of the measurement site?
Background
Topic: Decomposition and Ecosystem Processes
This question tests your ability to interpret data on decomposition rates and relate them to environmental factors like temperature.
Key Terms and Concepts:
Decomposition: The breakdown of organic matter by decomposers, releasing nutrients back into the ecosystem.
Mean annual temperature: The average temperature over a year at a given site.
Step-by-Step Guidance
Examine the trend in the graph: as mean annual temperature increases, what happens to the percent of mass lost?
Consider why temperature might affect the activity of decomposers and the rate of decomposition.
Think about how this relationship could impact nutrient cycling in different ecosystems (e.g., subarctic vs. temperate).
Formulate an inference based on the observed trend in the data.
Try solving on your own before revealing the answer!
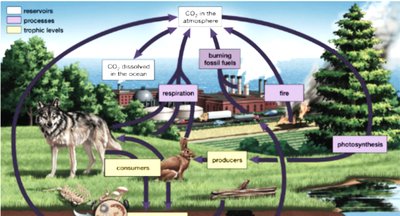
Q19. Explain how CO2 cycles from living organisms into the abiotic environment and back.
Background
Topic: Carbon Cycle in Ecosystems
This question focuses on the movement of carbon dioxide between living (biotic) and nonliving (abiotic) components of ecosystems.
Key Terms and Concepts:
Photosynthesis: The process by which producers convert CO2 from the atmosphere into organic molecules.
Respiration: The process by which organisms release CO2 back into the atmosphere.
Decomposition: Releases CO2 as decomposers break down dead material.
Fossil fuels: Burning releases stored carbon as CO2.
Step-by-Step Guidance
Describe how plants take in CO2 from the atmosphere during photosynthesis and convert it into organic compounds.
Explain how animals and other organisms obtain carbon by consuming plants or other organisms, and release CO2 through respiration.
Discuss the role of decomposers in returning CO2 to the atmosphere as they break down dead organisms.
Mention how human activities (e.g., burning fossil fuels) add CO2 to the atmosphere.
Try solving on your own before revealing the answer!
