 Back
BackThe Scientific Method: Foundations of Biological Inquiry
Study Guide - Smart Notes
 Tailored notes based on your materials, expanded with key definitions, examples, and context.
The Scientific Method
Overview of the Scientific Method
The scientific method is a systematic approach used in biology and other sciences to investigate observations, answer questions, and test hypotheses. It is designed to produce results that are repeatable and verifiable, ensuring that scientific knowledge is reliable and self-correcting as new data emerges.
Repeatable: Experiments and observations can be duplicated by others.
Verifiable: Results can be confirmed by independent researchers.
Self-correcting: Hypotheses are refined as observations become more precise.
Steps of the Scientific Method
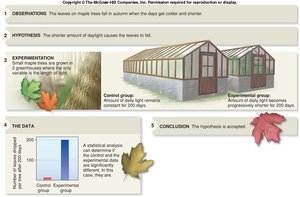
Observation: Careful and precise noticing of phenomena in the natural world. For example, observing that rattlesnakes are active at night.
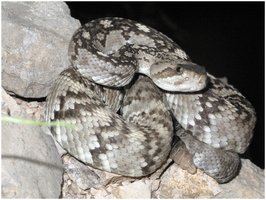
Question: Formulating a question based on the observation. Example: Why do rattlesnakes come out at night?
Hypothesis: A tentative and testable explanation for the observation. It is an educated guess or a proposed explanation that must account for all available data and can be proven false, but not true.
Example hypotheses for rattlesnake behavior:
They are sensitive to bright light.
It is cooler at night.
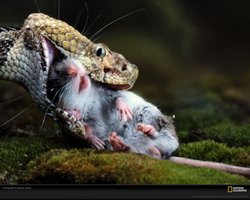
Their prey is more active at night.
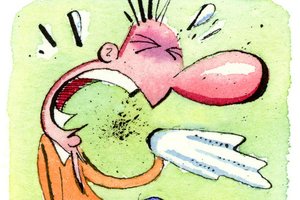
Prediction: A specific result expected from testing the hypothesis, usually in an "if/then" format. Example: If vitamin C decreases the risk of catching a cold, then people who take vitamin C supplements will experience fewer colds than those who do not.
Experiment: A controlled test to evaluate the prediction. Only one variable is tested at a time to ensure reliable results.
Conclusion: Interpretation of the experimental results to accept, reject, or refine the hypothesis. For example, concluding that rattlesnakes come out at night because their prey is more active.
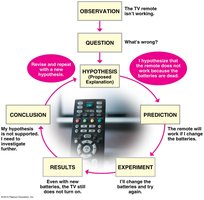
Visualizing the Scientific Method
Flowcharts and diagrams can help clarify the logical progression of the scientific method from observation to conclusion.
Designing Experiments
Elements of an Experiment
Experiments are structured to test hypotheses by manipulating variables and observing outcomes. Key elements include:
Experimental Variable: The component being tested. Only one variable should be tested at a time to isolate its effect.
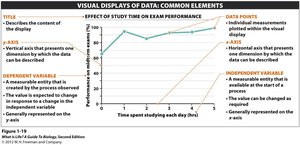
Independent Variable: The parameter that the investigator changes (plotted on the X-axis).
Dependent Variable: The result measured during the experiment, which changes in response to the independent variable (plotted on the Y-axis).
Example: Fermentation Experiment
Independent Variable: Amount of glucose supplied to yeast.
Dependent Variable: Amount of alcohol produced.
Example: Leaf Color Experiment
Independent Variable: Type of tree (sugar maple, sweet gum, beech, aspen).
Dependent Variable: Loss of chlorophyll (leaf color change).
Experimental and Control Groups
Experimental Group: Receives the experimental variable.
Control Group: Does not receive the experimental variable; serves as a baseline for comparison.
Standards: Elements that remain the same in both groups to ensure a fair test.
Graphing and Displaying Data
Principles of Graphing Data
Graphs are essential for visualizing experimental results. Every graph should:
Have a descriptive title
Clearly label each axis with appropriate units
Start at the origin and extend beyond the greatest data point
Use the whole graphing area
Types of Data and Graphs
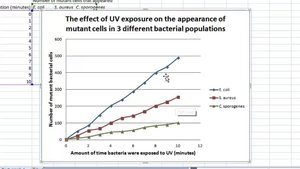
Continuous Data: Physical measurements with infinite possible values between points (use a line graph).
Discrete Data: Finite number of possibilities (use a bar graph). Example: male or female.
Sample Graphs and Data Displays
Summary Table: Key Elements of the Scientific Method
Step | Description | Example |
|---|---|---|
Observation | Careful noticing of phenomena | Rattlesnakes are active at night |
Question | Formulate a question about the observation | Why do rattlesnakes come out at night? |
Hypothesis | Testable explanation | They come out at night because their prey is more active |
Prediction | Expected result if hypothesis is correct | If prey is more active at night, then rattlesnakes will hunt at night |
Experiment | Test the prediction | Observe rattlesnake and prey activity at different times |
Conclusion | Interpret results | Rattlesnakes hunt at night because prey is more active |
Additional info: The scientific method is foundational to all biological research and underpins the reliability of scientific knowledge. Mastery of experimental design, variable identification, and data presentation is essential for success in biology.
