 Back
Cellular Respiration: Citric Acid Cycle & Electron Transport System
Study Guide - Smart Notes
 Tailored notes based on your materials, expanded with key definitions, examples, and context.
Cellular Respiration
Overview of Cellular Respiration
Cellular respiration is the process by which cells extract energy from nutrients, primarily glucose, to produce ATP, the energy currency of the cell. This process involves multiple stages, including glycolysis, the citric acid cycle, and the electron transport system.
Glycolysis: Occurs in the cytoplasm; breaks down glucose into pyruvate.
Citric Acid Cycle (Krebs Cycle): Occurs in the mitochondria; further catabolizes products of glycolysis.
Electron Transport System: Located in the inner mitochondrial membrane; produces the majority of ATP.
Lecture Objectives
List the steps of the citric acid cycle and electron transport system.
Explain the role of co-enzymes in energy production.
Discuss metabolism of glycogen, fats, and proteins.
Describe anaerobic metabolic pathways.
Citric Acid Cycle (Krebs Cycle)
Location and Sequence
The citric acid cycle occurs in the inner membrane region of the mitochondria. For each glucose molecule, the cycle operates twice, once for each acetyl group derived from glucose catabolism.
Acetyl CoA: Delivers acetyl group to the cycle.
Oxaloacetate: Combines with acetyl to form citric acid.
Citric Acid: Metabolized, releasing CO2 and transferring electrons to NAD+ and FAD.
Stepwise Breakdown
Acetyl CoA + Oxaloacetate → Citric Acid
Citric Acid → α-Ketoglutarate (CO2 released, NAD+ → NADH)
α-Ketoglutarate → Succinate (CO2 released, NAD+ → NADH, ADP → ATP)
Succinate → Fumarate (FAD → FADH2)
Fumarate → Oxaloacetate (NAD+ → NADH)
Coenzyme Roles
NAD+: Picks up hydrogen and electrons, forming NADH.
FAD: Picks up hydrogen and electrons, forming FADH2.
Summary of Citric Acid Cycle
ATP: 2 molecules produced by substrate-level phosphorylation.
NADH: 6 molecules produced.
FADH2: 2 molecules produced.
CO2: 4 molecules released as waste.
Electron Transport System (ETS)
Mechanism
The electron transport system is located in the inner mitochondrial membrane. NADH and FADH2 deliver electrons and hydrogen ions to carrier proteins, which transfer electrons through a series of proteins, releasing energy.
Carrier proteins use energy from electrons to pump H+ ions to the outer membrane.
H+ ions diffuse back through ATP synthase, catalyzing ATP formation from ADP and inorganic phosphate.
Process is called oxidative phosphorylation.
Summary of Electron Transport System
ATP: Approximately 34 molecules produced.
Water: 6 molecules produced as waste.
NAD+ and FAD: Recycled for further use.
Overall Energy Production
ATP: 38 molecules produced, 2 used for NADH transport, net gain = 36 ATP.
CO2: 6 molecules produced as waste.
H2O: 6 molecules produced as waste.
Metabolism of Glycogen, Fats, and Proteins
Energy Sources
The body utilizes glycogen, fats, and proteins to produce ATP. Fats are the primary energy reserve, followed by proteins and glycogen.
Glycogen: 1% of energy reserves.
Fats: 78% of energy reserves.
Proteins: 21% of energy reserves.
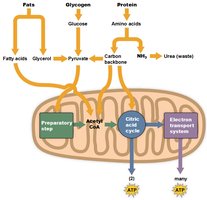
Fat Catabolism
Triglycerides break down into glycerol and fatty acids.
Glycerol can be converted to glucose or pyruvate.
Fatty acids are converted to acetyl groups for the citric acid cycle.
Fats produce about twice as much ATP as glycogen.
Protein Catabolism
Proteins are broken into amino acids.
Amine group (NH2) is removed and excreted as urea.
Remaining carbon backbone enters the citric acid cycle.
Protein catabolism increases during starvation, leading to muscle wasting.
Anaerobic Respiration
Energy Production Without Oxygen
Cells can produce ATP anaerobically for short periods. Glycolysis is an example of anaerobic respiration, where pyruvate is converted to lactic acid instead of entering the mitochondria.
Lactic Acid: Responsible for muscle burning and cramping when oxygen is unavailable.
ATP: Produced quickly but in limited amounts.
Key Equations
ATP Formation
Substrate-level phosphorylation:
Oxidative phosphorylation:
Water formation:
Summary Table: Energy Production from Different Sources
Source | Pathway | ATP Yield | Waste Products |
|---|---|---|---|
Glycogen | Glycolysis → Citric Acid Cycle → ETS | ~36 ATP per glucose | CO2, H2O |
Fats | Fatty acids → Acetyl CoA → Citric Acid Cycle → ETS | ~2x ATP vs. glycogen | CO2, H2O |
Proteins | Amino acids → Carbon backbone → Citric Acid Cycle → ETS | Similar to glycogen | CO2, H2O, Urea |
References
Johnson, M.D. (2017). Human biology: Concepts and current issues (8th ed). Pearson Education Inc.
