Skip to main content
Intermediate Algebra
My Course
Learn
AI Tutor
Study Guides
Flashcards
Explore
Try the app
My Course
Learn
AI Tutor
Study Guides
Flashcards
Explore
Try the app
Back
Graph Linear Equations in Two Variables quiz
You can tap to flip the card.
What is the standard form of a linear equation in two variables?
You can tap to flip the card.
👆
What is the standard form of a linear equation in two variables?
The standard form is ax + by = c, where a, b, and c are constants.
Track progress
Control buttons has been changed to "navigation" mode.
1/15
Related flashcards
Recommended videos
Graph Linear Equations in Two Variables definitions
Graph Linear Equations in Two Variables
15 Terms
03:07
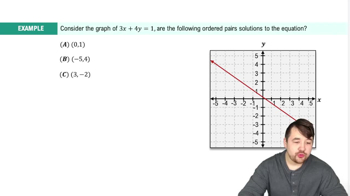
Graphing Linear Equations in Two Variables Example 1
94
views
3
rank
02:35
Graphing Linear Equations in Two Variables Example 2
92
views
2
rank
05:51
Graphing Linear Equations in Two Variables
158
views
6
rank
Terms in this set (15)
Hide definitions
What is the standard form of a linear equation in two variables?
The standard form is ax + by = c, where a, b, and c are constants.
How do you find ordered pair solutions for a linear equation in two variables?
You select x-values and solve for the corresponding y-values to create ordered pairs.
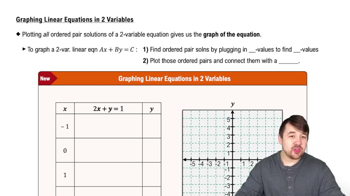
What is the first step in graphing a linear equation in two variables?
The first step is to find ordered pair solutions by plugging in x-values and solving for y.
After finding ordered pairs, what should you do next when graphing?
Plot the ordered pairs on the graph and connect them with a straight line.
Why is it important to plot at least three points when graphing a linear equation?
Plotting at least three points ensures you can accurately draw the line representing the equation.
What does the line you draw through the plotted points represent?
The line represents all possible solutions to the linear equation in two variables.
If x-values are not given, what should you do?
You can choose your own x-values, typically values like -1, 0, 1, and 2.
What is the ordered pair solution when x = -1 for the equation 2x + y = 1?
When x = -1, y = 3, so the ordered pair is (-1, 3).
What is the ordered pair solution when x = 0 for the equation 2x + y = 1?
When x = 0, y = 1, so the ordered pair is (0, 1).
What is the ordered pair solution when x = 1 for the equation 2x + y = 1?
When x = 1, y = -1, so the ordered pair is (1, -1).
What is the ordered pair solution when x = 2 for the equation 2x + y = 1?
When x = 2, y = -3, so the ordered pair is (2, -3).
What does connecting the plotted points with a line show about the equation?
It shows the general trend and all possible solutions for the equation.
Are the plotted points the only solutions to the equation?
No, every point on the line, including those between and beyond the plotted points, is a solution.
What is the purpose of extending the line with arrows on the graph?
Arrows indicate that the line continues infinitely in both directions, representing all solutions.
How does graphing linear equations help understand the relationship between variables?
It visually shows how changes in one variable affect the other and illustrates the concept of slope and intercepts.
 BackBack
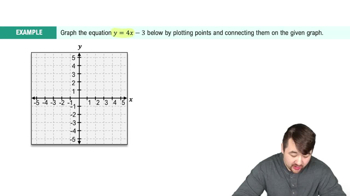
 03:07
03:07