Graphing linear equations in two variables involves plotting ordered pair solutions on a coordinate plane to visualize all possible solutions. A linear equation in two variables typically takes the form ax + by = c, where a, b, and c are constants. To graph such an equation, you start by selecting values for one variable, usually x, and then solve for the corresponding y values. This process generates ordered pairs (x, y) that satisfy the equation.
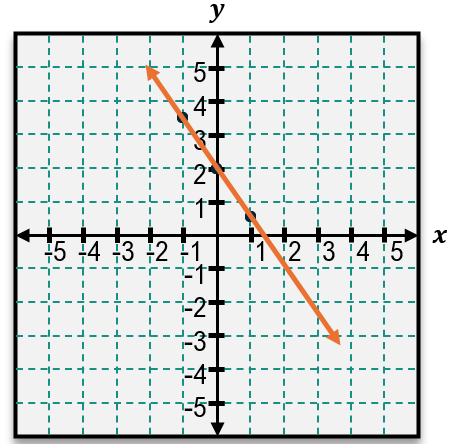
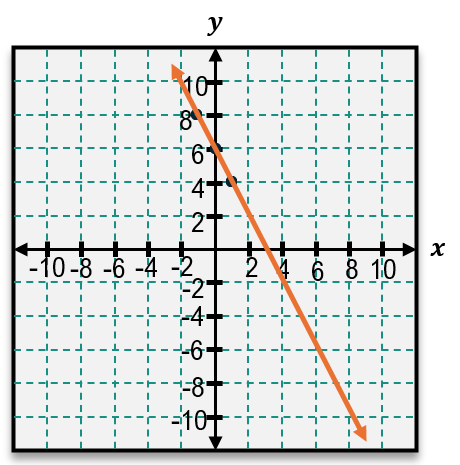
For example, consider the equation \(2x + y = 1\). To find ordered pairs, substitute chosen x values into the equation and solve for y. If x = -1, then:
\[2(-1) + y = 1 \implies -2 + y = 1 \implies y = 3\]
This gives the ordered pair (-1, 3). Repeating this for x = 0, 1, 2 yields:
For x = 0: \[2(0) + y = 1 \implies y = 1\]
For x = 1: \[2(1) + y = 1 \implies 2 + y = 1 \implies y = -1\]
For x = 2: \[2(2) + y = 1 \implies 4 + y = 1 \implies y = -3\]
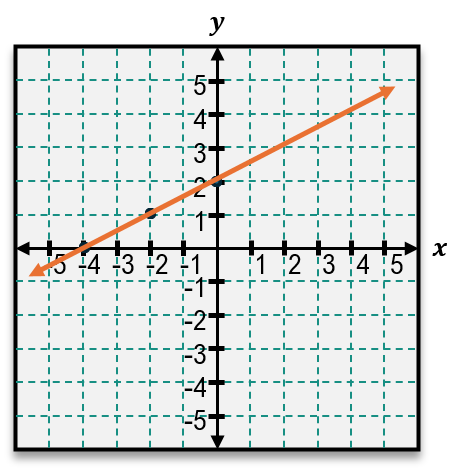
Plotting these points (-1, 3), (0, 1), (1, -1), and (2, -3) on a graph and connecting them with a straight line reveals the graph of the equation. This line represents all solutions to the equation, not just the plotted points. The line extends infinitely in both directions, indicating that every point on the line is a valid solution.
When specific x values are not provided, you can select convenient values such as -1, 0, 1, and 2 to find corresponding y values. Plotting at least three points ensures accuracy in drawing the line. This method helps visualize the relationship between variables and understand the set of all solutions to a linear equation in two variables.