Skip to main content
Intermediate Algebra
My Course
Learn
AI Tutor
Study Guides
Flashcards
Explore
Try the app
My Course
Learn
AI Tutor
Study Guides
Flashcards
Explore
Try the app
Back
Linear Inequalities in Two Variables quiz
You can tap to flip the card.
How do you determine if an ordered pair is a solution to a linear inequality in two variables?
You can tap to flip the card.
👆
How do you determine if an ordered pair is a solution to a linear inequality in two variables?
Plug the x and y values of the ordered pair into the inequality; if the statement is true, the pair is a solution.
Track progress
Control buttons has been changed to "navigation" mode.
1/15
Related flashcards
Recommended videos
Linear Inequalities in Two Variables definitions
Linear Inequalities in Two Variables
15 Terms
05:47
Intro to Linear Inequalities in Two Variables
102
views
3
rank
Guided course
7:02
Graphing Linear Inequalities in Two Variable
88
views
3
rank
Guided course
3:55
Graphing Linear Inequalities in Two Variable Example 1
67
views
2
rank
Terms in this set (15)
Hide definitions
How do you determine if an ordered pair is a solution to a linear inequality in two variables?
Plug the x and y values of the ordered pair into the inequality; if the statement is true, the pair is a solution.
What is the difference between the solution set of a linear equation and a linear inequality in two variables?
A linear equation's solutions lie on a line, while a linear inequality's solutions form a region on the graph.
What type of line do you draw for the inequality y ≥ 2x - 4?
You draw a solid line because the inequality includes 'equal to.'
What type of line do you draw for the inequality y > 2x - 4?
You draw a dashed line because the inequality does not include 'equal to.'
How do you decide which side of the line to shade when graphing a linear inequality?
Test a point not on the line (often (0,0) if possible); if it satisfies the inequality, shade that side.
If the inequality is y < x, which side of the line y = x do you shade?
You shade below the line y = x.
What does the shaded region represent in the graph of a linear inequality?
It represents all the points (x, y) that satisfy the inequality.
What is the first step in graphing a linear inequality in two variables?
Graph the corresponding line by replacing the inequality symbol with an equal sign.
When do you use a solid line versus a dashed line when graphing inequalities?
Use a solid line for ≤ or ≥ and a dashed line for < or >.
How can you quickly determine which region to shade for inequalities in the form y > mx + b or y < mx + b?
For y > mx + b, shade above the line; for y < mx + b, shade below the line.
If a point lies on the boundary line of a graphed inequality, when is it included in the solution set?
It is included if the inequality is ≤ or ≥, but not if it is < or >.
What does it mean if plugging a point into a linear inequality gives a false statement?
The point is not a solution and lies outside the shaded region.
How do you test if a point like (2, 0) is a solution to x ≥ 1?
Plug x = 2 into the inequality; since 2 ≥ 1 is true, (2, 0) is a solution.
What is the shortcut for shading when the inequality is solved for y?
If the inequality is y > (or ≥) something, shade above the line; if y < (or ≤), shade below.
Why is it often easier to test points on the axes when determining which region to shade?
Because one of the variables will be zero, making calculations simpler.
 BackBack
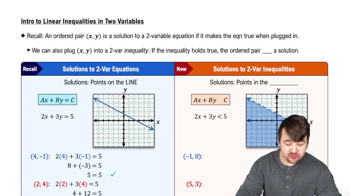
 05:47
05:47
