 Back
Multifactorial Traits, Heritability, and Human Evolution: Study Notes for Introductory Biology
Study Guide - Smart Notes
 Tailored notes based on your materials, expanded with key definitions, examples, and context.
Multifactorial Traits & Heritability
Introduction to Multifactorial Traits
Multifactorial traits are characteristics influenced by multiple genetic and environmental factors. Unlike monogenic traits, which are determined by a single gene, multifactorial traits involve complex interactions between several genes and environmental influences.
Monogenic (Mendelian) Traits: Caused by a single gene (e.g., cystic fibrosis).
Polygenic Traits: Influenced by many genes (e.g., height, skin color).
Multifactorial Traits: Traits affected by both genetic and environmental factors (e.g., obesity, intelligence).
Heritability
Heritability is a statistical measure that estimates the proportion of variation in a trait within a population that is due to genetic differences among individuals. It is important to note that heritability is population-specific and does not apply to individuals.
Definition: Heritability quantifies the genetic contribution to phenotypic variation in a population.
Calculation: Often estimated using correlations between relatives (e.g., parent-offspring, twin studies).
Limitations: Heritability does not indicate the importance of genes for a trait, nor does it apply across different populations or environments.
Patterns of Inheritance
Pleiotropy and Polygenic Inheritance
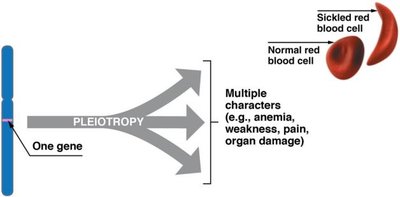
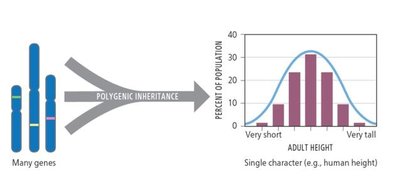
Pleiotropy occurs when one gene influences multiple phenotypic traits. Polygenic inheritance refers to the effect of many genes on a single character, resulting in continuous variation.
Pleiotropy: Example: The sickle-cell mutation affects multiple physical traits, including anemia and organ damage.
Polygenic Inheritance: Example: Human height and skin color are influenced by several genes.
Pedigrees and Tracking Genetic Traits
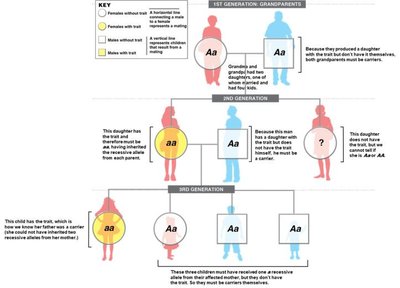
Pedigrees are diagrams used to track the inheritance of genetic traits in families. They help identify patterns of inheritance and carriers of genetic conditions.
Quantitative Traits and Normal Distribution
Quantitative Traits
Quantitative traits are controlled by multiple genes and show continuous variation in populations. Examples include height, weight, and intelligence.
Continuous Variation: Traits display a range of phenotypes rather than discrete categories.
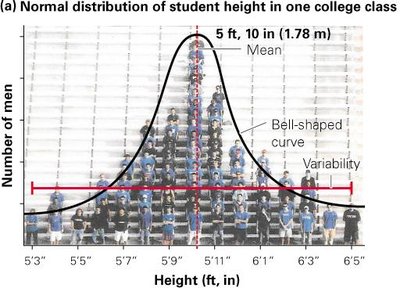
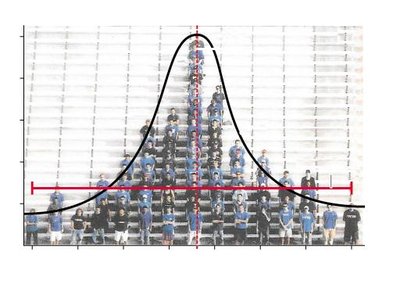
Normal Distribution: Quantitative traits often follow a bell-shaped curve, with most individuals near the mean.
Variance and Mean
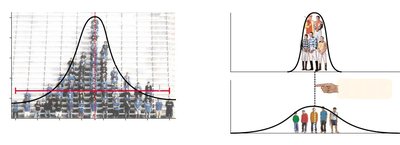
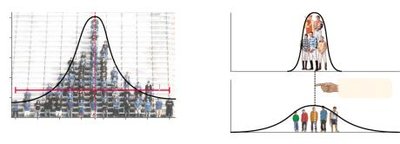
The mean is the average value of a trait, while variance measures the spread of values around the mean. High variance indicates greater diversity in the trait.
Mean: Calculated by summing all values and dividing by the number of individuals.
Variance: The average distance any individual is from the mean.
Human Evolution and Comparative Anatomy
Comparative Anatomy
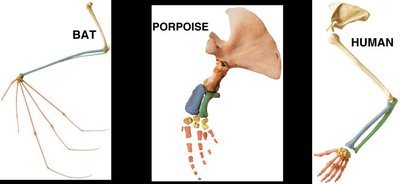
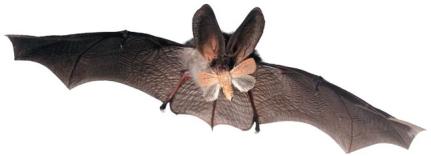
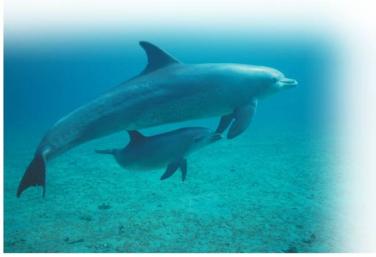
Comparative anatomy provides evidence for evolution by comparing the body structures of different organisms. Homologous structures, such as forelimbs, indicate common ancestry.
Homologous Structures: Similar bones in the forelimbs of bats, porpoises, and humans suggest evolutionary relationships.
Embryological Evidence
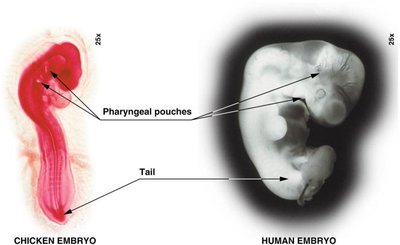
Embryos of different species often show similar features, such as pharyngeal pouches and tails, supporting the idea of common ancestry.
DNA and Bioinformatics
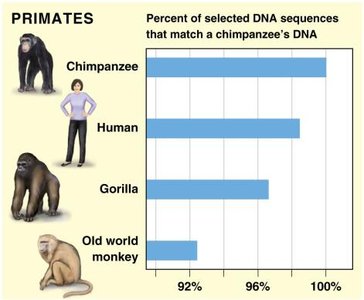
All life uses DNA as the genetic code. Closely related species have similar DNA and protein sequences. Bioinformatics uses computational tools to analyze genetic data.
DNA Sequence Similarity: Humans share a high percentage of DNA with chimpanzees and other primates.
Phylogenetic Tree of Primates
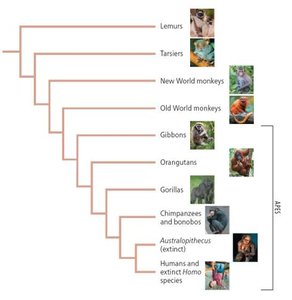
Phylogenetic trees illustrate evolutionary relationships among primates, showing humans as part of the order Primates.
Mammalian Diversity and Evolution
Mammalian Groups
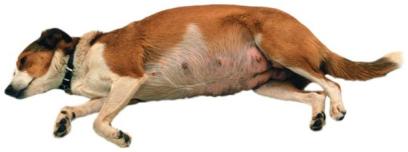
Mammals are tetrapods with hair and mammary glands. They are divided into monotremes, marsupials, and eutherians.
Monotremes: Egg-laying mammals (e.g., platypus).
Marsupials: Mammals with pouches (e.g., kangaroo).
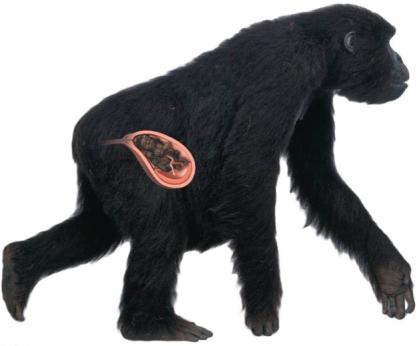
Eutherians: Placental mammals, offspring born fully developed.
Human Races and Genetic Diversity
Genetic Evidence of Divergence
Population genetics studies the effect of evolutionary change on allele frequencies. Allele frequency is calculated as the number of copies of an allele divided by the total number of alleles in the population.
Single Nucleotide Polymorphism (SNP): A single base pair difference in DNA sequence among individuals.
Genetic Ancestry: SNPs are used to identify genetic ancestry, but no SNP is found in all members of any population.
Human Races: Not Biological
Genetic evidence shows that human racial groups do not represent independent evolutionary groups. There is more genetic variability within races than between them.
No Unique Alleles: No single allele is found in all members of a race and not in others.
Convergent Adaptation: Similar traits, such as lactase persistence, can arise in different populations due to similar selection pressures.
Natural Selection and Human Adaptation
Lactase Persistence
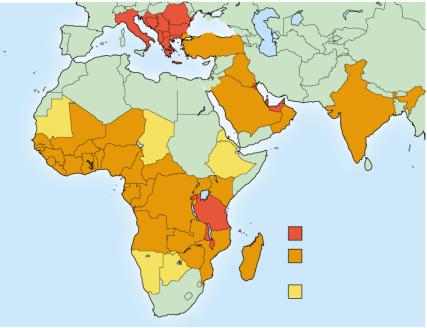
Lactase persistence is the continued ability to digest lactose into adulthood. Different populations have different SNPs in the lactase gene region, but the same effect: lactase persistence.
Sickle Cell Anemia
The sickle-cell allele is higher in environments with malaria. Having one sickle-cell allele increases fitness by reducing the ability of the malaria parasite to reproduce.
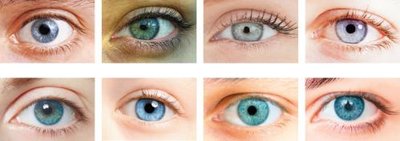
Polygenic Traits: Skin Color and Eye Color
Skin Color
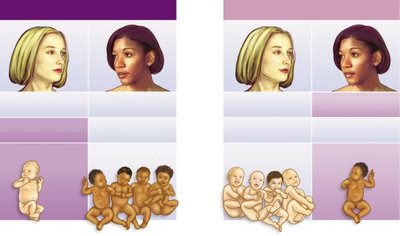
Skin color is determined by at least three genes and is affected by melanin production and distribution. Environmental factors, such as UV light, also influence skin color.
Heritability Studies: Twins and Natural Experiments
Twin Studies
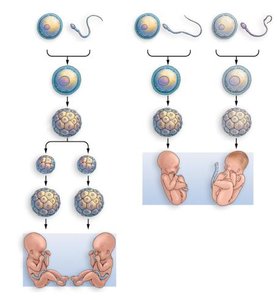
Twin studies compare monozygotic (identical) and dizygotic (fraternal) twins to separate genetic and environmental effects.
Monozygotic Twins: Develop from one zygote, 100% genetically identical.
Dizygotic Twins: Develop from two separate eggs, 50% genetically identical.
Heritability and Environment
Heritability values are unique to the measured population and environment. Differences between groups may be entirely environmental, as shown in experiments with mice and diet.
Epigenetics
Epigenetic Changes
Epigenetics studies changes in phenotypes caused by changes in gene expression rather than DNA sequence. Environmental factors can affect gene expression and may be passed to offspring.
Summary Table: Heritability and Environment
Phenotype | Normal Environment | Restricted Environment | Enriched Environment |
|---|---|---|---|
Maze-bright rats | 115 | 170 | 112 |
Maze-dull rats | 165 | 170 | 122 |
Explanation of Results | Maze-dull rats made more mistakes than maze-bright rats when running a maze. | Both groups made the same number of mistakes when running a maze. | Both groups made fewer mistakes when running the maze. The maze-dull rats improved the most. |
Obesity as a Multifactorial Trait
Obesity
Obesity is influenced by both genetic and environmental factors. It contributes to health problems such as type 2 diabetes, cancer, and cardiovascular disease.
BMI Formula:
Conclusion
Multifactorial traits and heritability are central concepts in understanding human biology. Both genetic and environmental factors contribute to the diversity of traits observed in populations. Evolutionary evidence, such as comparative anatomy and DNA analysis, supports the shared ancestry of humans and other organisms.
