 Back
BackChapter 15: Energy – Introduction to Chemistry Study Notes
Study Guide - Smart Notes
 Tailored notes based on your materials, expanded with key definitions, examples, and context.
Chapter 15: Energy
Energy and the Life-Support System
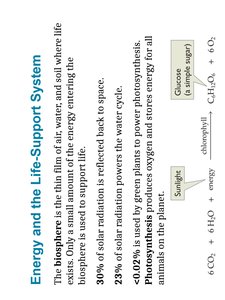
The biosphere is the thin film of air, water, and soil where life exists, and only a small amount of the energy entering the biosphere is used to support life. Most energy on Earth originates from the sun.
Solar radiation: 30% is reflected back to space.
Photosynthesis: Less than 0.02% is used by green plants to power photosynthesis, producing oxygen and storing energy for all animals on the planet.
Photosynthesis equation:
Glucose: A simple sugar produced by photosynthesis.
Energy In and Out
Almost all energy on Earth comes from the sun. The table below summarizes the main sources and sinks of energy.
Item | Energy (TW)* | Approximate Percentage |
|---|---|---|
Solar radiation | 174,000 | 99.97 |
Internal heat | 46 | 0.03 |
Tides | 3 | 0.002 |
Waste heat** | 13 | 0.007 |
Energy out | ||
Direct reflection | 52,000 | 30 |
Water cycle* | 40,000 | 23 |
Photosynthesis* | 30 | 0.02 |
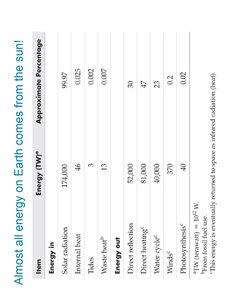
Additional info: *TW = terawatts; **Waste heat is eventually returned to space as infrared radiation.
Energy: Definition and Units
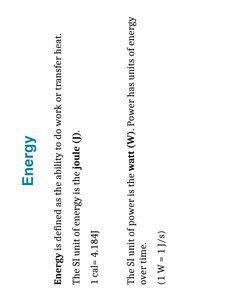
Energy is defined as the ability to do work or transfer heat. The SI unit of energy is the joule (J). Another common unit is the calorie (cal), where .
Power: The SI unit of power is the watt (W), which is energy per unit time ().
Power and Energy Conversion
Energy and power can be converted between units. For example, calculating the energy consumed by a light bulb:
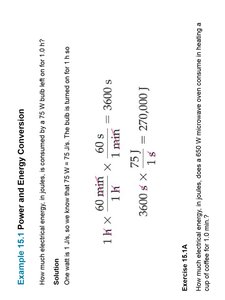
Example: A 75 W bulb burns for 1 hour. The energy consumed is:
Energy Release in Chemical Reactions
Chemical reactions often release or absorb energy. The amount of heat released can be calculated using stoichiometry.
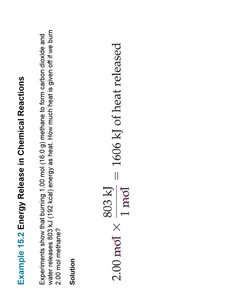
Example: Burning methane releases heat:
Energy Changes in Chemical Reactions
The energy change in a reaction can be calculated based on the mass and stoichiometry of reactants.
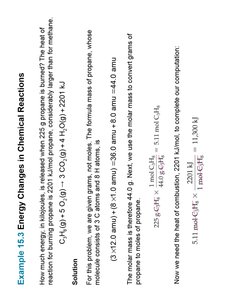
Example: Combustion of propane:
For 225 g propane:
Potential and Kinetic Energy
Energy exists in two main forms: kinetic and potential.
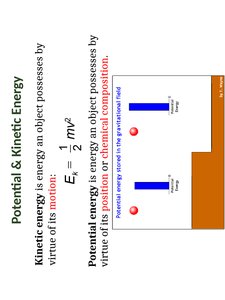
Kinetic energy: Energy an object possesses by virtue of its motion.
Potential energy: Energy an object possesses by virtue of its position or chemical composition.
Conversion of Energy
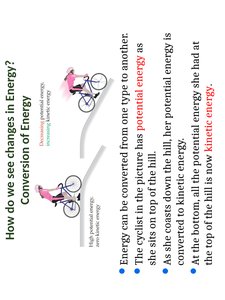
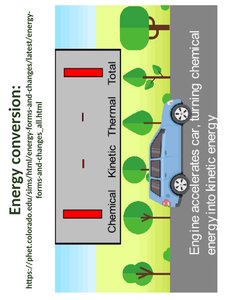
Energy can be converted from one type to another. For example, a cyclist at the top of a hill has potential energy, which is converted to kinetic energy as she descends.
At the top: Potential energy
At the bottom: Kinetic energy
Kinetic Energy and Particle Motion
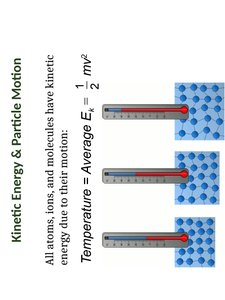
All atoms, ions, and molecules have kinetic energy due to their motion. Temperature is a measure of the average kinetic energy of particles.
Energy and Chemical Reactions
Several factors affect the rate of a chemical reaction:
Temperature: Increasing temperature increases reaction rates.
Concentration of reactants: Reaction rates depend on reactant concentration.
Presence of catalysts: Catalysts increase reaction rates by lowering activation energy.
Endothermic and Exothermic Changes
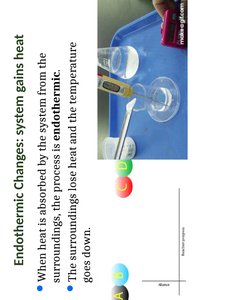
Energy changes in chemical reactions can be classified as endothermic or exothermic.
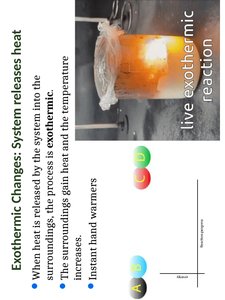
Endothermic: System absorbs heat from surroundings; temperature of surroundings decreases.
Exothermic: System releases heat to surroundings; temperature of surroundings increases.
Changes in Internal Energy of a Chemical System
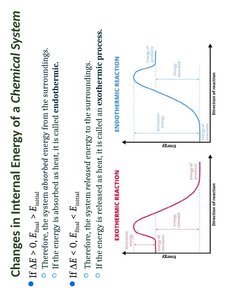
The internal energy change () of a system determines whether a process is endothermic or exothermic.
If , energy is absorbed (endothermic).
If , energy is released (exothermic).
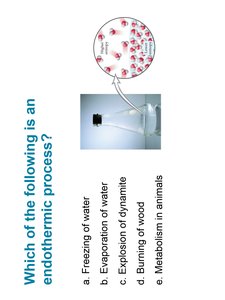
Examples of Endothermic and Exothermic Processes
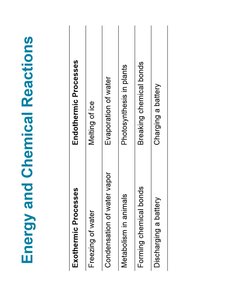
The table below classifies common processes as endothermic or exothermic.
Exothermic Processes | Endothermic Processes |
|---|---|
Freezing of water | Melting of ice |
Condensation of water vapor | Evaporation of water |
Metabolism in animals | Photosynthesis in plants |
Forming chemical bonds | Breaking chemical bonds |
Discharging a battery | Charging a battery |
First Law of Thermodynamics (Law of Conservation of Energy)
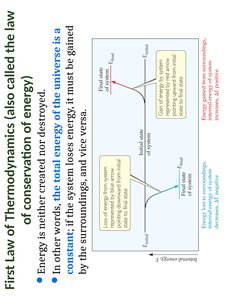
The first law states that energy is neither created nor destroyed. The total energy of the universe is constant; energy lost by a system must be gained by the surroundings and vice versa.
Spontaneous Processes
Spontaneous processes occur naturally without external input. Examples include waterfalls running downhill, sugar dissolving in coffee, and heat flowing from hot to cold objects.
Nonspontaneous processes require input of energy.
The Second Law of Thermodynamics
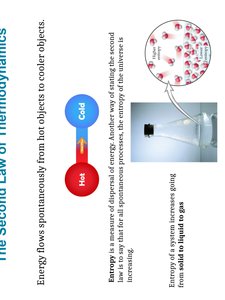
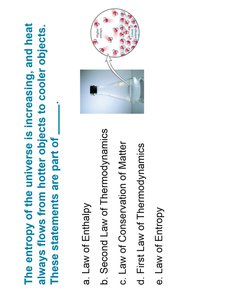
Energy flows spontaneously from hot objects to cooler objects. The entropy of the universe is always increasing.
Entropy: A measure of dispersal of energy; increases in all spontaneous processes.
People Power: Early Uses of Energy
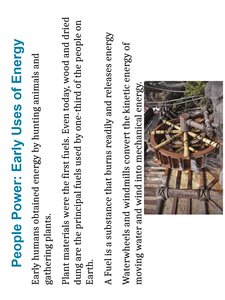
Early humans obtained energy by hunting, gathering, and using plant materials. Waterwheels and windmills convert kinetic energy of moving water and wind into mechanical energy.
Fossil Fuels
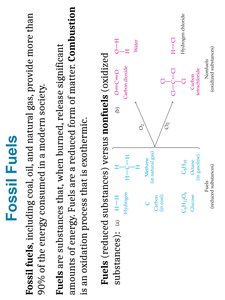
Fossil fuels, including coal, oil, and natural gas, provide more than 90% of the energy consumed in modern society. Fuels are substances that burn readily and release energy. Combustion is an exothermic oxidation process.
Fuels: Reduced substances; nonfuels: Oxidized substances.
Reserves and Consumption Rates of Fossil Fuels
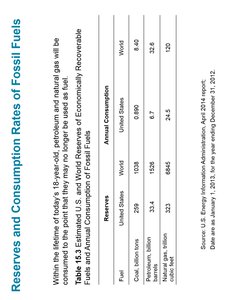
The table below shows estimated reserves and annual consumption of fossil fuels.
Reserves | World | United States |
|---|---|---|
Coal | 258 | 31.6 |
Petroleum | 1031 | 6.5 |
Natural gas | 6544 | 120 |
Coal: The Carbon Rock of Ages
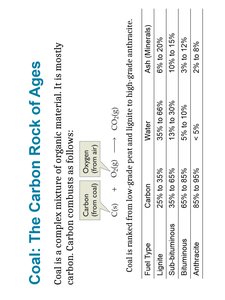
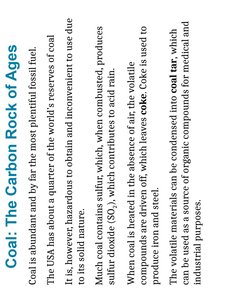
Coal is a complex mixture of organic material, mostly carbon. It is abundant and the most plentiful fossil fuel. Coal combusts to produce carbon dioxide and is ranked from low-grade peat to high-grade anthracite.
Fuel Type | Carbon | Water | Ash (Minerals) |
|---|---|---|---|
Lignite | 25% to 35% | 35% to 55% | 13% to 30% |
Sub-bituminous | 35% to 45% | 25% to 45% | 10% to 15% |
Bituminous | 45% to 85% | 10% to 20% | 5% to 10% |
Anthracite | 85% to 98% | 2% to 8% | < 5% |
Natural Gas: Mostly Methane
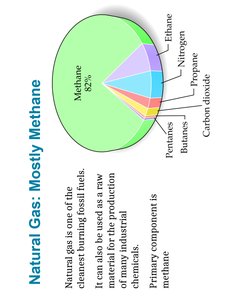
Natural gas is one of the cleanest burning fossil fuels. Its primary component is methane (CH4), but it also contains ethane, propane, butane, and other gases.
Petroleum: Liquid Hydrocarbons
Petroleum is a complex mixture of hydrocarbons and has displaced coal as a principal fuel. Its combustion with oxygen produces carbon dioxide and water.
Additional info: These notes cover the main concepts of energy in chemistry, including energy forms, conversion, chemical reactions, thermodynamics, and fossil fuels, suitable for exam preparation in an introductory chemistry course.
