 Back
BackEssential Math Skills for Introductory Chemistry
Study Guide - Smart Notes
 Tailored notes based on your materials, expanded with key definitions, examples, and context.
0. Math Skills for Chemistry
0.1 Place Values
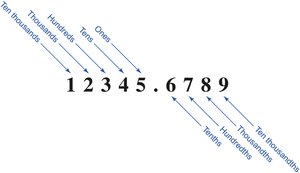
Understanding place values is fundamental for interpreting and manipulating numbers in chemistry, where measurements can range from extremely large to very small values. Each digit in a number has a specific place value, which determines its contribution to the overall value of the number.
Place Value: The position of a digit relative to the decimal point (e.g., ones, tens, hundreds, tenths, hundredths).
Implied Decimal: Numbers without a visible decimal point have an implied decimal at the end (e.g., 5280 is 5280.0).
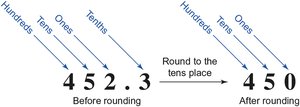
Rounding: Reducing the number of digits in a number to a specified place value using standard rules.
Rounding Rules:
If the first digit to be dropped is 5–9, increase the preceding digit by one (round up).
If the first digit to be dropped is 0–4, keep the preceding digit unchanged (round down).
Zeros are used as placeholders when rounding digits to the left of the decimal point.
Example: Round 4.7732 to the hundredths place: 4.77 (drop 3, which is less than 5, so do not change the preceding digit).
0.2 Negative Numbers
Negative numbers are frequently used in chemistry, such as in temperature, pH, and scientific notation. Calculators have a specific key for entering negative numbers, which is different from the subtraction key.
Change Sign Key: Used to toggle a number between positive and negative.
Calculator Usage: The sequence for entering negative numbers varies by calculator model.
Application: Essential for calculations involving temperature changes, energy, and other chemical properties.
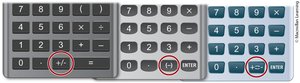

Example: Calculate −6 + 2 = −4. Enter 6, then the change sign key, then +, then 2, then =.
0.3 Exponents
Exponents, or powers, represent repeated multiplication and are common in scientific notation and chemical calculations.
Base: The number being multiplied.
Exponent: The number of times the base is multiplied by itself.
Negative Exponents: Indicate repeated division (reciprocal multiplication).
Calculator Functions: Most calculators have dedicated keys for exponents and square roots.
Example:
Special Cases: Any number to the power of zero is 1:
0.4 Order of Operations
Order of operations ensures consistent results in multi-step calculations. The mnemonic PEMDAS helps remember the sequence:
Parentheses
Exponents
Multiplication and Division (left to right)
Addition and Subtraction (left to right)
Scientific calculators follow this order automatically if expressions are entered correctly, including parentheses.
Example: (division before subtraction)
0.5 Rearranging Equations
Algebraic manipulation is essential for solving chemical equations for unknown variables. The goal is to isolate the variable of interest using algebraic operations.
Isolating Variables: Perform the same operation on both sides of the equation to maintain equality.
Variables in the Denominator: Invert both sides to move the variable to the numerator, then isolate.
Square Roots: If a variable is squared, take the square root of both sides to solve for the variable.
Example: Solve for in :
Divide both sides by :
0.6 Interpreting a Graph
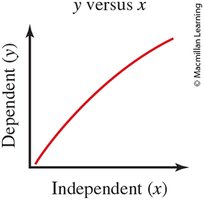
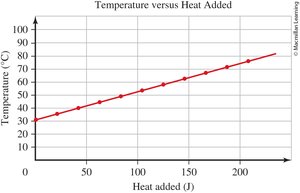
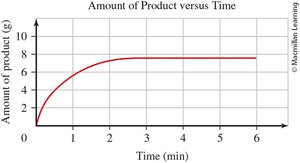
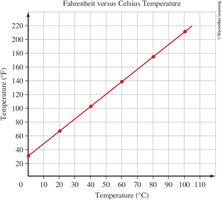
Graphs are used to visually represent relationships between variables in chemistry. Understanding how to read and interpret graphs is crucial for analyzing experimental data.
Line Graphs: Show how one variable changes in response to another.
Independent Variable (x-axis): The variable controlled or changed in the experiment.
Dependent Variable (y-axis): The variable measured or observed.
Graph Titles: Format is "[dependent variable] versus [independent variable]".
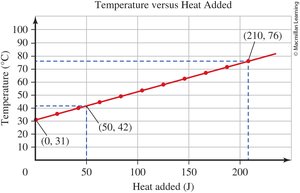
Data Points: Each point represents a pair of values (x, y).
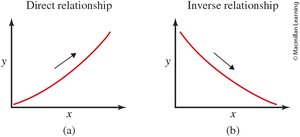
Direct Relationship: Both variables increase or decrease together.
Inverse Relationship: One variable increases while the other decreases.

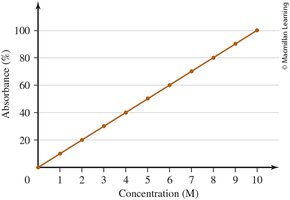
Example: In a graph of "Absorbance versus Concentration," concentration is the independent variable (x-axis), and absorbance is the dependent variable (y-axis).
Summary Table: Rounding Rules
Digit to Drop | Action |
|---|---|
5–9 | Increase preceding digit by 1 (round up) |
0–4 | Keep preceding digit unchanged (round down) |
Summary Table: Types of Relationships
Relationship | Description | Example |
|---|---|---|
Direct | Both variables increase or decrease together | Hours worked vs. money earned |
Inverse | One variable increases, the other decreases | Speed vs. travel time |
