 Back
BackQuantities in Chemical Reactions, Electrons in Atoms, and the Periodic Table: Structured Study Notes
Study Guide - Smart Notes
 Tailored notes based on your materials, expanded with key definitions, examples, and context.
Quantities in Chemical Reactions
Stoichiometry
Stoichiometry is the quantitative study of reactants and products in a chemical reaction. It uses the coefficients from a balanced chemical equation to determine the relationships between the amounts of substances involved.
Balanced Chemical Equation: The coefficients indicate the mole ratios between reactants and products.
Mole-to-Mole Conversion: Use the coefficients to convert between moles of different substances.
Example: Hydrogen gas combines with oxygen gas to form water:
Mole Ratios: For this reaction, the ratios are: , ,
General Solution Map: Mass A → mol A → mol B → mass B
Limiting Reactant
The limiting reactant is the substance that is completely consumed first in a reaction, thus determining the maximum amount of product that can be formed.
Identification: Calculate the amount of product each reactant can produce; the reactant producing the least is the limiting reactant.
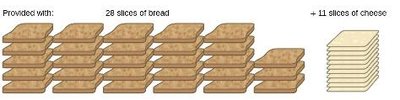
Example: Making grilled cheese sandwiches: 2 slices of bread + 1 slice of cheese → 1 sandwich. If you have 28 slices of bread and 11 slices of cheese, the cheese is the limiting reactant because it allows for only 11 sandwiches.

Yields
Yield refers to the amount of product formed in a chemical reaction.
Theoretical Yield (TY): The maximum amount of product that can be formed from the limiting reactant, calculated using stoichiometry.
Actual Yield (AY): The amount of product actually obtained from the reaction.
Percent Yield: Indicates the efficiency of a reaction.
Example: If 98 kernels pop out of 115, percent yield is

Electrons in Atoms and the Periodic Table
Electromagnetic Radiation (EMR)
Electromagnetic radiation is energy that travels through space as waves and is fundamental to understanding atomic structure.
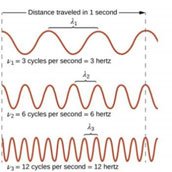
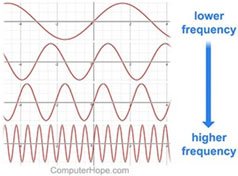
Wavelength (λ): The distance between adjacent wave crests.
Frequency (ν): The number of wave crests passing a point per second.
Relationship: Wavelength and frequency are inversely related:
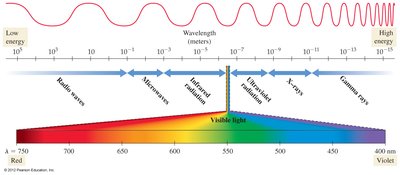
The Electromagnetic Spectrum
The electromagnetic spectrum includes all types of EMR, from radio waves to gamma rays, each with different wavelengths, frequencies, and energies.
Gamma Rays: Shortest wavelength, highest frequency, most energetic.
X-rays: Used for imaging; can damage biological molecules.
Ultraviolet (UV): Causes sunburn; can damage biological molecules.
Visible Light: 400–750 nm; responsible for vision.
Infrared: Emitted by warm objects; used in night vision.
Microwaves: Used in radar and ovens; absorbed by water.
Radio Waves: Used for communication.
Applications of EMR
Radiation Treatment: X-rays and gamma rays are used to destroy cancer cells.


Visible Light and Color
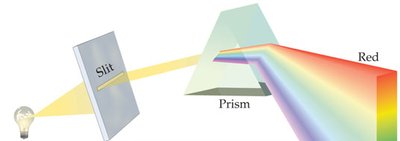
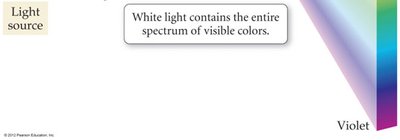
White Light: Contains all visible colors; can be separated by a prism.
Color in Objects: Objects appear colored due to selective reflection and absorption of light.


Emission Spectra
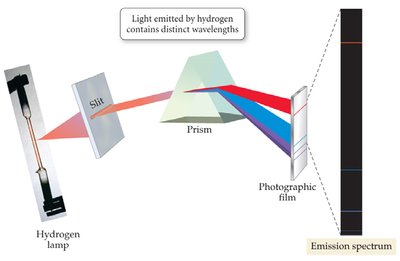
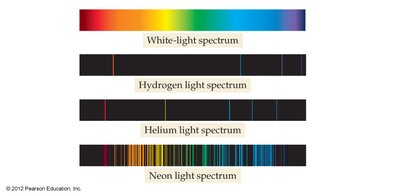
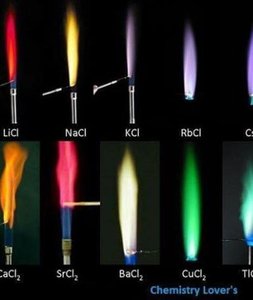
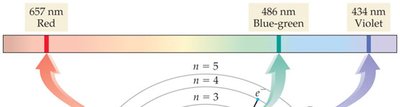
Emission Spectrum: Each element emits light at specific wavelengths, producing a unique spectrum.
Flame Tests: Used to identify elements by the color of their emission.
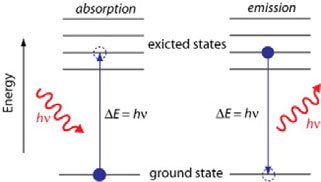
Bohr Model and Quantum Model
Bohr Model: Electrons orbit the nucleus in fixed energy levels; explains hydrogen atom behavior.
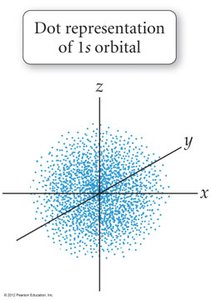
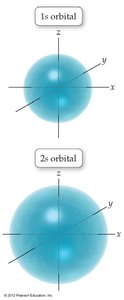
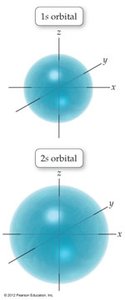
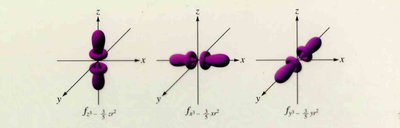
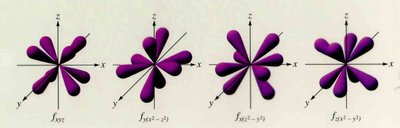
Quantum-Mechanical Model: Electrons occupy orbitals, which are probability maps, not fixed paths.

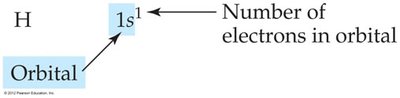
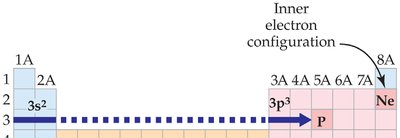
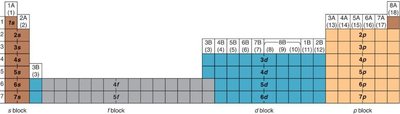
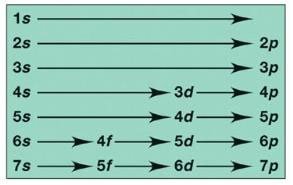
Orbitals and Electron Configuration
Orbitals: Defined by principal quantum number (n) and subshell (s, p, d, f).
Electron Configuration: Shows how electrons are distributed among orbitals.
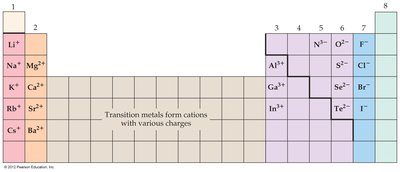
Valence Electrons: Electrons in the highest energy level; determine chemical properties.
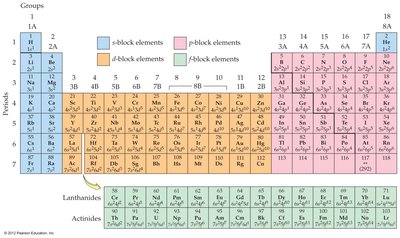
Periodic Trends
Periodic trends describe how properties of elements change across the periodic table.
Atomic Size: Increases down a group, decreases across a period.
Ionization Energy: Energy required to remove an electron; increases across a period, decreases down a group.
Metallic Character: Increases down a group, decreases across a period.
Tables
Periodic Table: Atomic Size, Ionization Energy, Metallic Character
Trend | Direction Across Period | Direction Down Group |
|---|---|---|
Atomic Size | Decreases | Increases |
Ionization Energy | Increases | Decreases |
Metallic Character | Decreases | Increases |
Additional info: This table summarizes the main periodic trends relevant to atomic structure and reactivity. ----------------------------------------
