 Indietro
Modern Issues and Solutions in Hypothesis Testing and Statistical Inference
Guida di studio - Note intelligenti
 Appunti personalizzati basati sui tuoi materiali, ampliati con definizioni chiave, esempi e contesto.
Null Hypothesis Significance Testing (NHST)
Overview of NHST
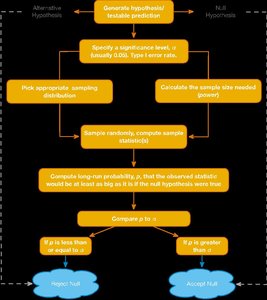
Null Hypothesis Significance Testing (NHST) is a foundational framework in inferential statistics used to determine whether observed data provide sufficient evidence to reject a null hypothesis in favor of an alternative hypothesis. The process involves formulating hypotheses, selecting a significance level, collecting data, and making a decision based on the comparison of the p-value to the chosen alpha level.
Null Hypothesis (H0): The default assumption that there is no effect or difference.
Alternative Hypothesis (Ha): The hypothesis that there is an effect or difference.
Alpha (α): The significance level, commonly set at 0.05, representing the probability of a Type I error (false positive).
p-value: The probability of obtaining results as extreme as those observed, assuming the null hypothesis is true.
Example: Testing whether a new teaching method improves test scores compared to a traditional method.
Common Misconceptions about p-values
There are several widespread misconceptions about the interpretation of p-values and statistical significance:
Misconception 1: A significant result means the effect is important. Correction: Statistical significance is influenced by sample size; even trivial effects can be significant with large samples.
Misconception 2: A non-significant result means the null hypothesis is true. Correction: Non-significance only indicates insufficient evidence to detect an effect, not proof of no effect.
Misconception 3: A significant result means the null hypothesis is false. Correction: Significance only suggests data are inconsistent with the null, not that it is definitively false.
Example: A tutoring program increases average scores from 75% to 76% in a sample of 20,000 students. The result is statistically significant, but the effect size is minimal and may not be practically important.
All-or-Nothing Thinking in NHST
NHST often encourages binary thinking—results are either 'significant' or 'not significant.' This can lead to discarding potentially meaningful findings or overvaluing trivial ones. Replication and effect size estimation provide a more nuanced understanding.
Problems with NHST in Scientific Practice
Incentive Structures and Publication Bias
Scientific publishing often favors significant, novel, or surprising results, leading to publication bias. This can distort the scientific record and incentivize questionable research practices.
Researchers with significant findings are more likely to be published and advance their careers.
Null results are less likely to be published, even if methodologically sound.
Researcher Degrees of Freedom
Researchers make many decisions during study design and analysis (e.g., choice of alpha, sample size, statistical model, handling outliers). These choices can unintentionally or intentionally bias results toward significance.
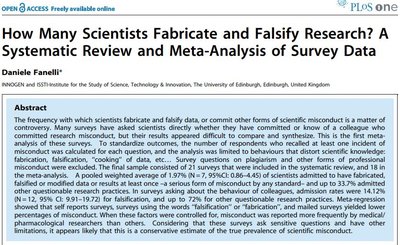
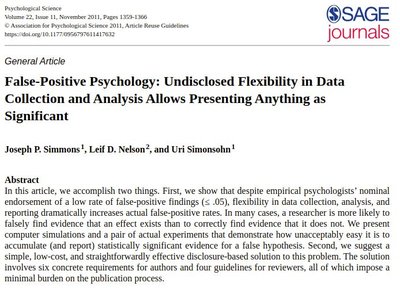
Studies show a notable proportion of scientists have observed or engaged in questionable research practices, including data fabrication or selective reporting.
p-hacking and HARKing
p-hacking refers to manipulating data or analyses until statistically significant results are found. HARKing (Hypothesizing After Results are Known) involves presenting post hoc hypotheses as if they were specified a priori.
Examples include selectively reporting outcomes, stopping data collection early, or transforming variables to achieve significance.
ASA Statement on p-values
Key Points from the American Statistical Association (ASA)
p-values indicate the compatibility of data with a specified statistical model (usually the null hypothesis).
They do not measure the probability that the hypothesis is true or that the data were produced by chance alone.
Scientific conclusions should not be based solely on whether a p-value crosses a specific threshold (e.g., 0.05).
Proper inference requires full reporting and transparency to avoid p-hacking.
p-values do not measure effect size or importance of a result.
Context and additional evidence are essential for valid interpretation.
Solutions and Alternatives to NHST
Preregistration and Open Science
Preregistration involves publicly documenting the research plan, hypotheses, and analysis strategy before data collection. This increases transparency and reduces questionable research practices.
Open science promotes sharing data, methods, and results to enhance reproducibility and trust.
Clinical trials and some journals now require preregistration.

Effect Sizes
An effect size is a standardized measure of the magnitude of an observed effect, allowing for comparison across studies and contexts. Unlike p-values, effect sizes are less dependent on sample size and provide more meaningful information about practical significance.
Cohen’s d: Used for group differences.
Pearson’s r: Used for correlation strength.
Odds Ratio/Risk Rate: Used for categorical data.
Formulas:
Cohen's d:
Pooled Standard Deviation:
Pearson's r:
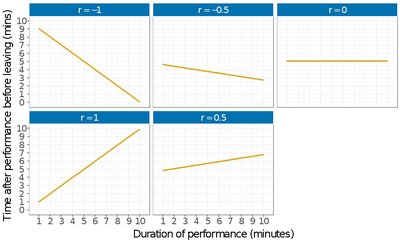
Interpretation:
Small effect: , (explains 1% of variance)
Medium effect: , (explains 9% of variance)
Large effect: , (explains 25% of variance)
Advantages: Effect sizes encourage interpretation on a continuum and are less confounded by sample size or arbitrary thresholds.
Meta-Analysis
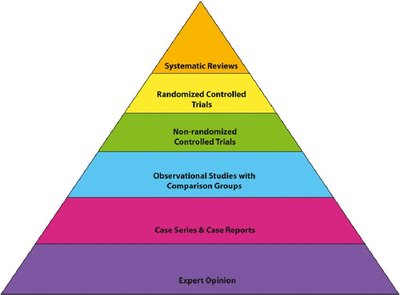
Meta-analysis combines effect sizes from multiple studies on the same research question, weighting each by its precision. This provides a more accurate estimate of the population effect and reduces reliance on p-values.
Large studies contribute more to the overall estimate than small studies.
Meta-analysis addresses publication bias and the limitations of single studies.
Bayesian Estimation
Bayesian methods provide an alternative to NHST by estimating the probability of hypotheses given the data. They allow for direct evaluation of evidence for the null hypothesis and are less affected by sample size or stopping rules.
Bayes’ Theorem:
Bayes Factor: Quantifies evidence for one hypothesis over another.
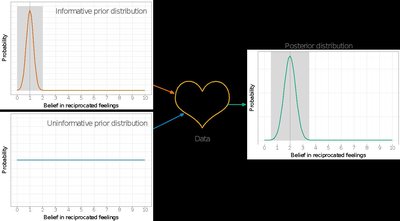
Benefits: Bayesian approaches focus on estimation and interpretation, reducing incentives for p-hacking and supporting more nuanced conclusions.
Practical Application: JAMOVI Exercises
Understanding Statistical Significance with Sample Size
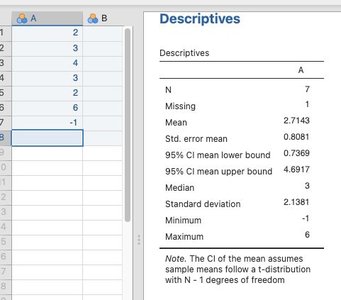
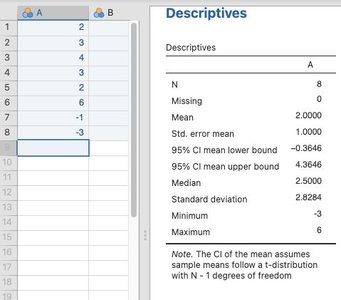
Statistical software such as JAMOVI can be used to explore how sample size and hypothesis specificity affect statistical significance. Increasing sample size can make even small effects statistically significant, highlighting the importance of considering effect size and context.
Two samples of 20 showed no significant difference; increasing to 26 per group yielded significance.
Small effects can become significant with large samples, but may not be practically important.
Summary Table: Key Concepts and Solutions
Issue | Explanation | Solution/Alternative |
|---|---|---|
Misinterpretation of p-values | p-values do not indicate effect importance or truth of hypotheses | Report effect sizes, confidence intervals, and context |
Publication bias | Significant results more likely to be published | Preregistration, open science, meta-analysis |
p-hacking/HARKing | Selective reporting and post hoc hypotheses | Preregistration, transparency, Bayesian methods |
All-or-nothing thinking | Binary interpretation of significance | Emphasize effect sizes, meta-analysis, Bayesian estimation |
