Ch. 1 - Functions
Briggs - Calculus: Early Transcendentals 3rd Edition
Briggs3rd EditionCalculus: Early TranscendentalsISBN: 9780136847243Non è quello che usi tu?Cambia libro di testo
Capitolo 1, Problema 14c

Use the graph of ff in the figure to plot the following functions.
<IMAGE>
y=f(x−2)y=f\(\left\)(x-2\(\right\))

Guida verificata passo dopo passo
1
Identify the transformation involved in the function y = f(x - 2). This represents a horizontal shift of the graph of f(x) to the right by 2 units.
Examine the key points on the original graph of f(x). These points will help in accurately shifting the graph.
Shift each key point of the graph of f(x) 2 units to the right. For example, if a point on f(x) is (a, b), it will become (a+2, b) on the graph of y = f(x - 2).
Redraw the graph using the shifted points to represent y = f(x - 2). Ensure that the shape and orientation of the graph remain unchanged, only the position is altered.
Verify the transformation by checking that all points have been shifted correctly and the overall graph maintains the same features as the original, just translated horizontally.

Risposta video verificata per un problema simile:

Questa soluzione video è stata consigliata dai nostri tutor come utile per risolvere questo problema.
Durata del video:
4m

Concetti chiave

Ecco i concetti essenziali che devi comprendere per rispondere correttamente alla domanda.

Function Transformation

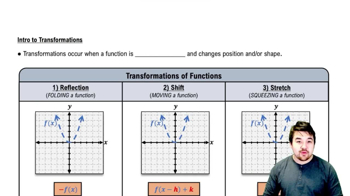
Function transformation refers to the process of altering the graph of a function through various operations, such as shifting, stretching, or reflecting. In the context of the question, the function y = f(x - 2) represents a horizontal shift of the original function f by 2 units to the right. Understanding how these transformations affect the graph is crucial for accurately plotting the new function.
Video consigliato:
Percorso guidato
5:25
Intro to Transformations

Graphing Functions

Graphing functions involves plotting points on a coordinate system to visually represent the relationship between the input (x-values) and output (y-values) of a function. This process requires knowledge of the function's behavior, including its intercepts, asymptotes, and overall shape. In this question, students must apply their graphing skills to represent the transformed function based on the original graph of f.
Video consigliato:
Percorso guidato
5:53
Graph of Sine and Cosine Function

Horizontal Shifts

Horizontal shifts occur when a function is modified by adding or subtracting a constant to the input variable. Specifically, in the function y = f(x - 2), the '-2' indicates a shift to the right by 2 units. This concept is essential for understanding how the graph of the function changes position on the x-axis, which directly impacts the overall appearance of the graph.
Video consigliato:
Percorso guidato
5:28
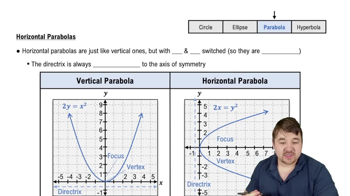
Horizontal Parabolas