Ch. 3 - Derivatives
Briggs - Calculus: Early Transcendentals 3rd Edition
Briggs3rd EditionCalculus: Early TranscendentalsISBN: 9780136847243Non è quello che usi tu?Cambia libro di testo
Capitolo 3, Problema 3.10.62c

62–65. {Use of Tech} Graphing f and f'
c. Verify that the zeros of f' correspond to points at which f has a horizontal tangent line.
f(x) = (x−1) sin^−1 x on [−1,1]

Guida verificata passo dopo passo
1
Step 1: Understand the problem. We need to verify that the zeros of the derivative of the function f(x) = (x-1) \(\sin\)^{-1}(x) correspond to points where the original function f(x) has a horizontal tangent line.
Step 2: Find the derivative f'(x). Use the product rule for differentiation, which states that if you have a function h(x) = u(x)v(x), then h'(x) = u'(x)v(x) + u(x)v'(x). Here, u(x) = (x-1) and v(x) = \(\sin\)^{-1}(x).
Step 3: Differentiate u(x) and v(x). The derivative of u(x) = (x-1) is u'(x) = 1. The derivative of v(x) = \(\sin\)^{-1}(x) is v'(x) = \(\frac{1}{\sqrt{1-x^2}\)}.
Step 4: Apply the product rule. Substitute u(x), u'(x), v(x), and v'(x) into the product rule formula to find f'(x). This gives f'(x) = 1 \(\cdot\) \(\sin\)^{-1}(x) + (x-1) \(\cdot\) \(\frac{1}{\sqrt{1-x^2}\)}.
Step 5: Find the zeros of f'(x). Set f'(x) = 0 and solve for x. These x-values are where the derivative is zero, indicating potential horizontal tangent lines on the graph of f(x). Verify these points by checking the graph of f(x) to see if the tangent is indeed horizontal at these x-values.

Risposta video verificata per un problema simile:

Questa soluzione video è stata consigliata dai nostri tutor come utile per risolvere questo problema.
Durata del video:
5m

Concetti chiave

Ecco i concetti essenziali che devi comprendere per rispondere correttamente alla domanda.

Derivative and Critical Points

The derivative of a function, denoted as f', represents the rate of change of the function f. Critical points occur where the derivative is zero or undefined, indicating potential local maxima, minima, or points of inflection. In this context, finding the zeros of f' helps identify where the function f has horizontal tangent lines, which are essential for understanding the function's behavior.
Video consigliato:
04:50
Critical Points

Horizontal Tangent Lines

A horizontal tangent line occurs at points on the graph of a function where the slope is zero. This means that the derivative of the function at those points is equal to zero. In the given problem, verifying that the zeros of f' correspond to horizontal tangents involves checking that these points indicate where the function f does not increase or decrease, thus providing insights into its local behavior.
Video consigliato:
Percorso guidato
05:13
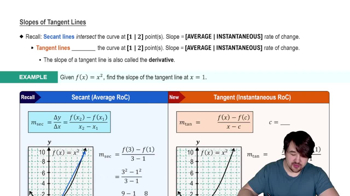
Slopes of Tangent Lines

Graphing Functions

Graphing a function involves plotting its values on a coordinate system to visualize its behavior. For the function f(x) = (x−1) sin^−1 x, understanding its graph helps in identifying critical points and the nature of its tangents. By analyzing the graph of both f and its derivative f', one can visually confirm the relationship between the zeros of f' and the horizontal tangents of f.
Video consigliato:
Percorso guidato
5:53
Graph of Sine and Cosine Function
Pratica correlata
Domanda del libro di testo

Tangents and inverses Suppose L(x)=ax+b (with a≠0) is the equation of the line tangent to the graph of a one-to-one function f at (x0,y0). Also, suppose M(x)=cx+d is the equation of the line tangent to the graph of f^−1 at (y0,x0).


c. Prove that L^−1(x)=M(x).

154
views
Domanda del libro di testo

62–65. {Use of Tech} Graphing f and f'

c. Verify that the zeros of f' correspond to points at which f has a horizontal tangent line.

f(x)=e^−x tan^−1 x on [0,∞)

145
views
Domanda del libro di testo

Deriving trigonometric identities

c. Differentiate both sides of the identity sin 2t = 2 sin t cost to prove that cos 2t = cos²t−sin²t.

478
views
Domanda del libro di testo

City urbanization City planners model the size of their city using the function A(t) = - 1/50t² + 2t +20, for 0 ≤ t ≤ 50, where A is measured in square miles and t is the number of years after 2010.

c. Suppose the population density of the city remains constant from year to year at 1000 people mi². Determine the growth rate of the population in 2030.

297
views
Domanda del libro di testo

Vertical tangent lines If a function f is continuous at a and lim x→a| f′(x)|=∞, then the curve y=f(x) has a vertical tangent line at a, and the equation of the tangent line is x=a. If a is an endpoint of a domain, then the appropriate one-sided derivative (Exercises 71–72) is used. Use this information to answer the following questions.

73. {Use of Tech} Graph the following functions and determine the location of the vertical tangent lines.

c. f(x) = √|x-4|

239
views
Domanda del libro di testo

97–100. Logistic growth Scientists often use the logistic growth function P(t) = P₀K / P₀+(K−P₀)e^−r₀t to model population growth, where P₀ is the initial population at time t=0, K is the carrying capacity, and r₀ is the base growth rate. The carrying capacity is a theoretical upper bound on the total population that the surrounding environment can support. The figure shows the sigmoid (S-shaped) curve associated with a typical logistic model. <IMAGE>


{Use of Tech} Gone fishing When a reservoir is created by a new dam, 50 fish are introduced into the reservoir, which has an estimated carrying capacity of 8000 fish. A logistic model of the fish population is P(t) = 400,000 / 50+7950e^−0.5t, where t is measured in years.


c. How fast (in fish per year) is the population growing at t=0? At t=5?

200
views