Ch. 3 - Derivatives
Briggs - Calculus: Early Transcendentals 3rd Edition
Briggs3rd EditionCalculus: Early TranscendentalsISBN: 9780136847243Non è quello che usi tu?Cambia libro di testo
Capitolo 3, Problema 3.2.45a

Analyzing slopes Use the points A, B, C, D, and E in the following graphs to answer these questions. <IMAGE>
a. At which points is the slope of the curve negative?

Guida verificata passo dopo passo
1
Step 1: Understand that the slope of a curve at a point is determined by the derivative of the function at that point. A negative slope indicates that the function is decreasing at that point.
Step 2: Identify the points on the graph where the curve is sloping downwards as you move from left to right. These are the points where the slope is negative.
Step 3: Examine the graph visually or use the derivative function if available to determine the slope at each point A, B, C, D, and E.
Step 4: For each point, check if the tangent line to the curve at that point has a negative slope. This can be done by observing if the tangent line is angled downwards from left to right.
Step 5: List the points where the slope is negative based on your observations from the graph or calculations from the derivative.

Risposta video verificata per un problema simile:

Questa soluzione video è stata consigliata dai nostri tutor come utile per risolvere questo problema.
Durata del video:
1m

Concetti chiave

Ecco i concetti essenziali che devi comprendere per rispondere correttamente alla domanda.

Slope of a Curve

The slope of a curve at a given point represents the rate of change of the function at that point. It is determined by the derivative of the function, which indicates how steeply the curve rises or falls. A positive slope means the curve is increasing, while a negative slope indicates it is decreasing.
Video consigliato:
11:41
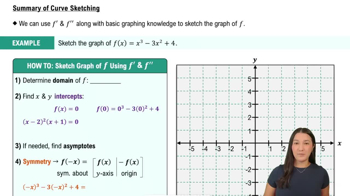
Summary of Curve Sketching

Negative Slope

A negative slope occurs when the curve descends as you move from left to right. This means that as the x-values increase, the y-values decrease. Identifying points with a negative slope is crucial for understanding where the function is decreasing, which can be visually assessed on a graph.
Video consigliato:
3:56
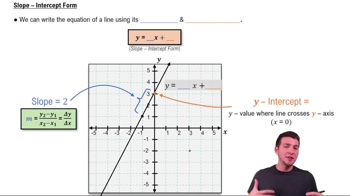
Slope-Intercept Form

Graphical Analysis

Graphical analysis involves examining the visual representation of a function to determine its characteristics, such as slope. By observing the curve's behavior at various points, one can identify intervals of increase and decrease, as well as specific points where the slope changes from positive to negative or vice versa.
Video consigliato:
05:02
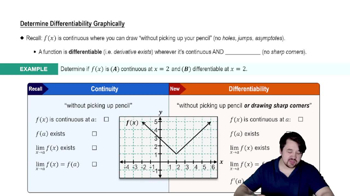
Determining Differentiability Graphically