Ch. 9 - Differential Equations
Briggs - Calculus: Early Transcendentals 3rd Edition
Briggs3rd EditionCalculus: Early TranscendentalsISBN: 9780136847243Non è quello che usi tu?Cambia libro di testo
Capitolo 9, Problema 9.5.13

9–14. Growth rate functions Make a sketch of the population function P (as a function of time) that results from the following growth rate functions. Assume the population at time t = 0 begins at some positive value.


<IMAGE>

Guida verificata passo dopo passo
1
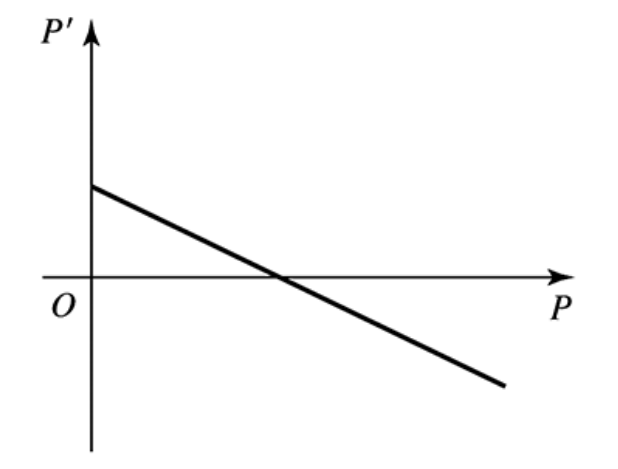
Step 1: Understand the graph provided. The graph shows the growth rate function \(P'\) (rate of change of population) on the vertical axis and the population \(P\) on the horizontal axis. The line is decreasing and crosses the \(P'\) axis at a positive value and crosses the \(P\) axis at a positive value where \(P' = 0\).
Step 2: Interpret the meaning of the graph. Since \(P'\) is positive when \(P\) is small and decreases linearly to zero at some positive population value, this suggests that the population grows when it is small but the growth rate slows down as the population approaches a certain carrying capacity (where \(P' = 0\)). Beyond this point, the growth rate becomes negative, meaning the population decreases if it exceeds this carrying capacity.
Step 3: Write the differential equation that models this behavior. The graph suggests a linear relationship of the form $P' = a - bP$, where \(a\) and \(b\) are positive constants. This is a classic logistic growth rate function where \(P'\) decreases linearly with \(P\).
Step 4: Sketch the population function \(P(t)\). Since \(P'\) is positive for \(P\) less than the carrying capacity and negative for \(P\) greater than the carrying capacity, the population \(P(t)\) will increase over time and approach the carrying capacity asymptotically. The graph of \(P(t)\) will be an S-shaped curve (sigmoid), starting from the initial positive population and leveling off at the carrying capacity.
Step 5: Summarize the behavior. The population grows quickly when small, slows down as it approaches the carrying capacity, and stabilizes at that carrying capacity over time. This is typical logistic growth behavior.

Risposta video verificata per un problema simile:

Questa soluzione video è stata consigliata dai nostri tutor come utile per risolvere questo problema.
Durata del video:
2m

Concetti chiave

Ecco i concetti essenziali che devi comprendere per rispondere correttamente alla domanda.

Growth Rate Function and Population Function Relationship

The growth rate function P' represents the rate of change of the population P over time. Understanding how P' depends on P helps determine the shape of the population function. If P' is positive, the population grows; if negative, it declines. The graph shows P' as a function of P, which guides the behavior of P(t).
Video consigliato:
04:39
Derivative of the Natural Logarithmic Function Example 7

Equilibrium Points and Stability

Equilibrium points occur where the growth rate P' equals zero, meaning the population stops changing. Stability depends on the slope of P' near these points: if P' decreases with P, the equilibrium is stable, and the population tends to return to it. In the graph, the zero crossing of P' indicates such an equilibrium.
Video consigliato:
04:50
Critical Points

Sketching Population Functions from Growth Rates

To sketch P(t), analyze the sign and magnitude of P' for different P values. When P' is positive, P increases; when negative, P decreases. The linear decrease of P' with P suggests logistic-type growth, where population grows initially and then stabilizes at an equilibrium. Initial conditions affect the specific trajectory.
Video consigliato:
Percorso guidato
06:16
Real World Application