
Ch.12 - Parametric and Polar Curves
Briggs - Calculus: Early Transcendentals 3rd Edition
Briggs3rd EditionCalculus: Early TranscendentalsISBN: 9780136847243Non è quello che usi tu?Cambia libro di testo
Capitolo 12, Problema 12.4.65

63–66. Tracing hyperbolas and parabolas Graph the following equations. Then use arrows and labeled points to indicate how the curve is generated as θ increases from 0 to 2π. 


r = 3/(1 - cos θ)

Guida verificata passo dopo passo
1
Recognize that the given equation \(r = \frac{3}{1 - \cos \theta}\) is a polar equation representing a conic section. Since the denominator is of the form \(1 - e \cos \theta\) with \(e = 1\), this corresponds to a parabola in polar coordinates with the focus at the pole.
Identify the key features of the curve by analyzing the denominator \(1 - \cos \theta\). Note that when \(\cos \theta\) approaches 1, the denominator approaches zero, causing \(r\) to become very large, indicating a vertical asymptote or a direction where the curve extends to infinity.
Create a table of values for \(\theta\) at important points such as \(0\), \(\frac{\pi}{2}\), \(\pi\), \(\frac{3\pi}{2}\), and \(2\pi\). Calculate the corresponding \(r\) values (without final numeric evaluation) to understand the shape and direction of the curve at these angles.
Plot the points \((r, \theta)\) on the polar coordinate plane using the values from the table. Mark these points clearly and draw the curve smoothly through them, keeping in mind the behavior near the asymptote where \(r\) becomes very large.
Add arrows along the curve to indicate the direction of increasing \(\theta\) from \(0\) to \(2\pi\). Label key points corresponding to the angles used in the table to show how the curve is generated as \(\theta\) increases.

Risposta video verificata per un problema simile:

Questa soluzione video è stata consigliata dai nostri tutor come utile per risolvere questo problema.
Durata del video:
3m

Concetti chiave

Ecco i concetti essenziali che devi comprendere per rispondere correttamente alla domanda.

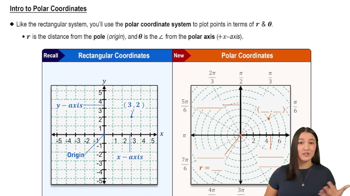
Polar Coordinates and Graphing

Polar coordinates represent points using a radius and an angle (r, θ) instead of Cartesian (x, y). Understanding how to plot points by varying θ and calculating r is essential for graphing curves like r = 3/(1 - cos θ). This system is particularly useful for curves with symmetry and periodicity.
Video consigliato:
05:32
Intro to Polar Coordinates

Conic Sections in Polar Form

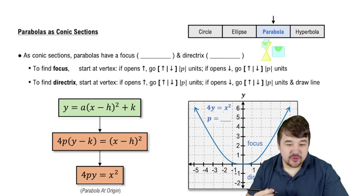
Equations like r = 3/(1 - cos θ) describe conic sections (parabolas, hyperbolas, ellipses) in polar form, where the denominator relates to the eccentricity and directrix. Recognizing this form helps identify the curve type and its geometric properties, such as focus and directrix positions.
Video consigliato:
Percorso guidato
5:33
Parabolas as Conic Sections

Parametric Tracing and Direction of Curves

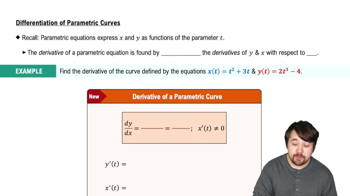
Tracing a curve as θ increases involves plotting points sequentially and using arrows to indicate direction. This helps visualize how the curve is generated over the interval 0 to 2π, showing behavior like loops or asymptotes and clarifying the curve’s orientation and shape.
Video consigliato:
Percorso guidato
06:49
Differentiation of Parametric Curves