


Ch. 3 - Derivatives
Hass - Thomas' Calculus 15th Edition
Hass15th EditionThomas' CalculusISBN: 9780137616077Non è quello che usi tu?Cambia libro di testo
Capitolo 3, Problema 3.1.24a

Interpreting Derivative Values


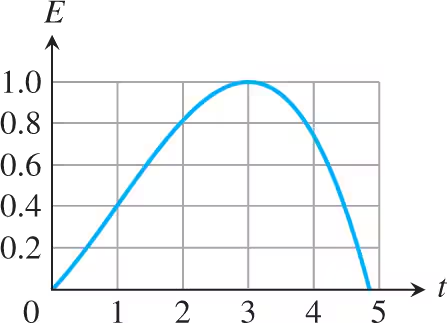
Effectiveness of a drug On a scale from 0 to 1, the effectiveness E of a pain-killing drug t hours after entering the bloodstream is displayed in the accompanying figure.


<IMAGE>
a. At what times does the effectiveness appear to be increasing? What is true about the derivative at those times?

Guida verificata passo dopo passo
1
Step 1: Observe the graph of the effectiveness E versus time t. The effectiveness E increases from t = 0 to t = 3, as the curve slopes upward during this interval.
Step 2: Recall that the derivative of a function represents the rate of change of the function. When the effectiveness E is increasing, the derivative dE/dt is positive.
Step 3: Identify the interval where the slope of the graph is positive. From the graph, the slope is positive from t = 0 to t = 3, indicating that the derivative dE/dt > 0 during this interval.
Step 4: Note that at t = 3, the graph reaches its maximum point, where the slope becomes zero. This means the derivative dE/dt = 0 at t = 3.
Step 5: Conclude that the effectiveness appears to be increasing during the interval 0 < t < 3, and the derivative is positive during this time.

Risposta video verificata per un problema simile:

Questa soluzione video è stata consigliata dai nostri tutor come utile per risolvere questo problema.
Durata del video:
2m

Concetti chiave

Ecco i concetti essenziali che devi comprendere per rispondere correttamente alla domanda.

Derivative and Increasing Function

The derivative of a function at a point gives the slope of the tangent line at that point. If the derivative is positive over an interval, the function is increasing on that interval. In the context of the drug's effectiveness, the derivative E'(t) is positive when the effectiveness is increasing, which can be observed from the graph where the slope is upward.
Video consigliato:
07:32
Determining Where a Function is Increasing & Decreasing

Critical Points and Maximum Effectiveness

Critical points occur where the derivative is zero or undefined, often indicating potential maxima or minima. In the graph, the effectiveness reaches a maximum when the derivative changes from positive to negative, which is around t = 3 hours. This is where the drug's effectiveness is at its peak before it starts to decrease.
Video consigliato:
04:50
Critical Points

Interpreting Graphs in Calculus

Understanding how to interpret graphs is crucial in calculus. The graph of E(t) shows the effectiveness of the drug over time. By analyzing the slope of the graph, one can determine intervals of increase or decrease. The graph indicates that the effectiveness increases from t = 0 to t = 3 and decreases thereafter, which aligns with the derivative's behavior.
Video consigliato:
Percorso guidato
05:22
Fundamental Theorem of Calculus Part 2