Solve each equation. Then state whether the equation is an identity, a conditional equation, or an inconsistent equation. (3x+1)/3 - 13/2 = (1-x)/4
Ch. 1 - Equations and Inequalities

Capitolo 2, Problema 28
Graph each equation in Exercises 13 - 28. Let x = - 3, - 2, - 1, 0, 1, 2, 3
y = x3 - 1
Guida verificata passo dopo passo1
Step 1: Understand the equation y = x^3 - 1. This is a cubic function, where the variable x is raised to the power of 3, and then 1 is subtracted. Cubic functions typically have an S-shaped curve when graphed.
Step 2: Create a table of values for the given x-values (-3, -2, -1, 0, 1, 2, 3). For each x-value, substitute it into the equation y = x^3 - 1 to calculate the corresponding y-value. For example, when x = -3, calculate y = (-3)^3 - 1.
Step 3: Plot the points (x, y) on a coordinate plane using the x-values and their corresponding y-values from the table. For example, if x = -3 gives y = -28, plot the point (-3, -28). Repeat this for all x-values.
Step 4: After plotting all the points, observe the general shape of the graph. Since this is a cubic function, the graph will have an S-shaped curve, increasing steeply for large positive x-values and decreasing steeply for large negative x-values.
Step 5: Draw a smooth curve through the plotted points to complete the graph. Ensure the curve reflects the behavior of a cubic function, smoothly transitioning through the points and extending in both directions.

Risposta video verificata per un problema simile:
Questa soluzione video è stata consigliata dai nostri tutor come utile per risolvere questo problema.
Durata del video:
2mConcetti chiave
Ecco i concetti essenziali che devi comprendere per rispondere correttamente alla domanda.
Graphing Functions
Graphing functions involves plotting points on a coordinate plane to visualize the relationship between the independent variable (x) and the dependent variable (y). For the equation y = x^3 - 1, you will calculate y for each given x value, creating a set of points that can be connected to form the graph. Understanding how to interpret these graphs is crucial for analyzing the behavior of the function.
Video consigliato:
Graphs of Logarithmic Functions
Cubic Functions
Cubic functions are polynomial functions of degree three, characterized by the general form y = ax^3 + bx^2 + cx + d. The graph of a cubic function can exhibit various shapes, including one or two turning points, and can extend infinitely in both directions. Recognizing the properties of cubic functions, such as their end behavior and symmetry, is essential for accurate graphing.
Video consigliato:
Function Composition
Evaluating Expressions
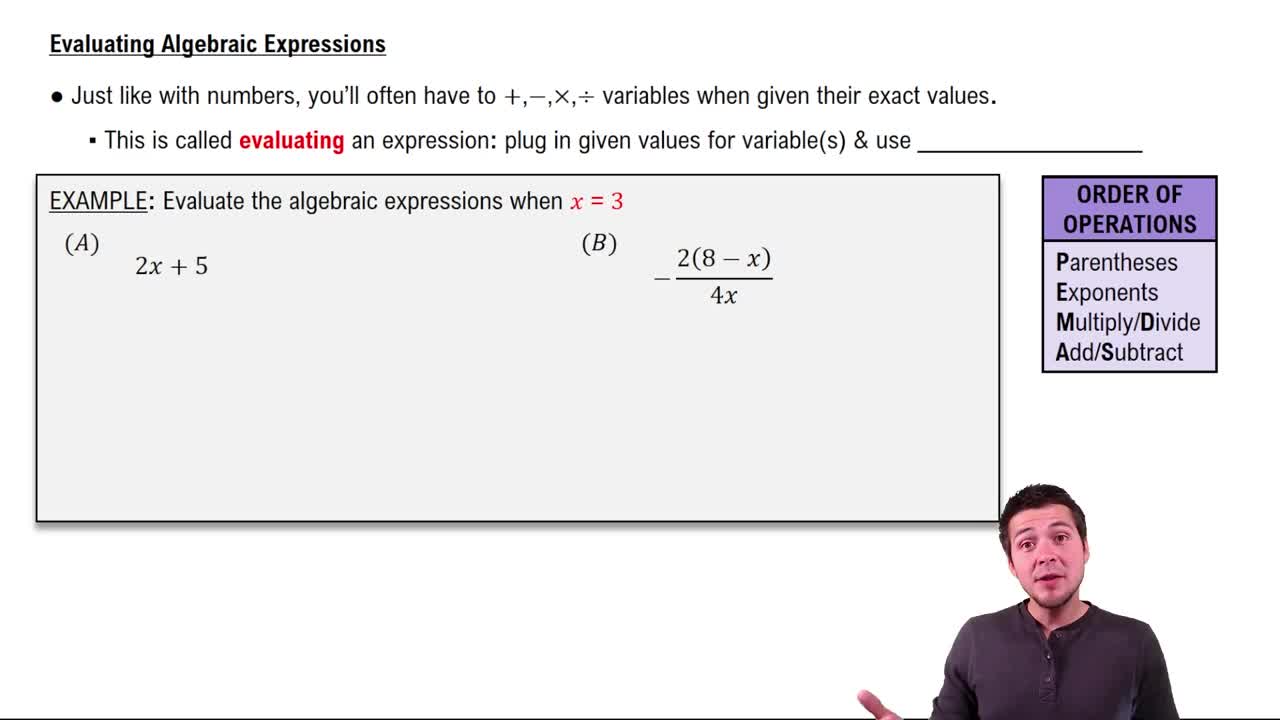
Evaluating expressions involves substituting specific values for variables in an equation to find the corresponding output. In this case, substituting the values of x (-3, -2, -1, 0, 1, 2, 3) into the equation y = x^3 - 1 allows you to compute the corresponding y values. Mastery of this skill is fundamental for graphing and understanding the function's behavior.
Video consigliato:
Evaluating Algebraic Expressions
Pratica correlata
Domanda del libro di testo
1008
views
Domanda del libro di testo
Solve each equation in Exercises 15–34 by the square root property.
780
views
Domanda del libro di testo
The length of a rectangular pool is 6 meters less than twice the width. If the pool's perimeter is 126 meters, what are its dimensions?
766
views
Domanda del libro di testo
Graph each equation in Exercises 13 - 28. Let x = - 3, - 2, - 1, 0, 1, 2, 3
y = x3
228
views
Domanda del libro di testo
In all exercises, other than exercises with no solution, use interval notation to express solution sets and graph each solution set on a number line. In Exercises 27–50, solve each linear inequality. 3x - 7 ≥ 13
909
views
Domanda del libro di testo
Exercises 27–40 contain linear equations with constants in denominators. Solve each equation. 20 - x/3 = x/2
943
views