Ch. 1 - Equations and Inequalities
Blitzer - College Algebra 8th Edition
Blitzer8th EditionCollege AlgebraISBN: 9780136970514Non è quello che usi tu?Cambia libro di testo
Capitolo 2, Problema 46a

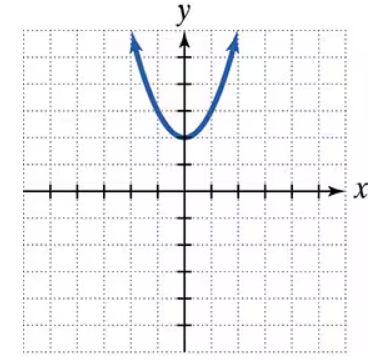
Use the graph to a. determine the x-intercepts, if any; b. determine the y-intercepts, if any. For each graph, tick marks along the axes represent one unit each.

Guida verificata passo dopo passo
1
Step 1: Observe the graph of the quadratic function provided. The graph is a parabola that opens upwards, and the tick marks along the axes represent one unit each.
Step 2: To determine the x-intercepts, locate the points where the graph crosses the x-axis. These are the points where the y-value is zero. From the graph, identify the x-coordinates of these points.
Step 3: To determine the y-intercept, locate the point where the graph crosses the y-axis. This is the point where the x-value is zero. From the graph, identify the y-coordinate of this point.
Step 4: Verify the intercepts by checking the coordinates visually on the graph. Ensure that the x-intercepts and y-intercept align with the tick marks provided.
Step 5: Summarize the intercepts: The x-intercepts are the points where the graph crosses the x-axis, and the y-intercept is the point where the graph crosses the y-axis.

Risposta video verificata per un problema simile:

Questa soluzione video è stata consigliata dai nostri tutor come utile per risolvere questo problema.
Durata del video:
1m

Concetti chiave

Ecco i concetti essenziali che devi comprendere per rispondere correttamente alla domanda.

X-Intercepts

X-intercepts are the points where a graph crosses the x-axis. At these points, the value of y is zero. To find the x-intercepts of a function, you set the function equal to zero and solve for x. In the context of a quadratic function, this often involves factoring or using the quadratic formula.
Video consigliato:
04:08
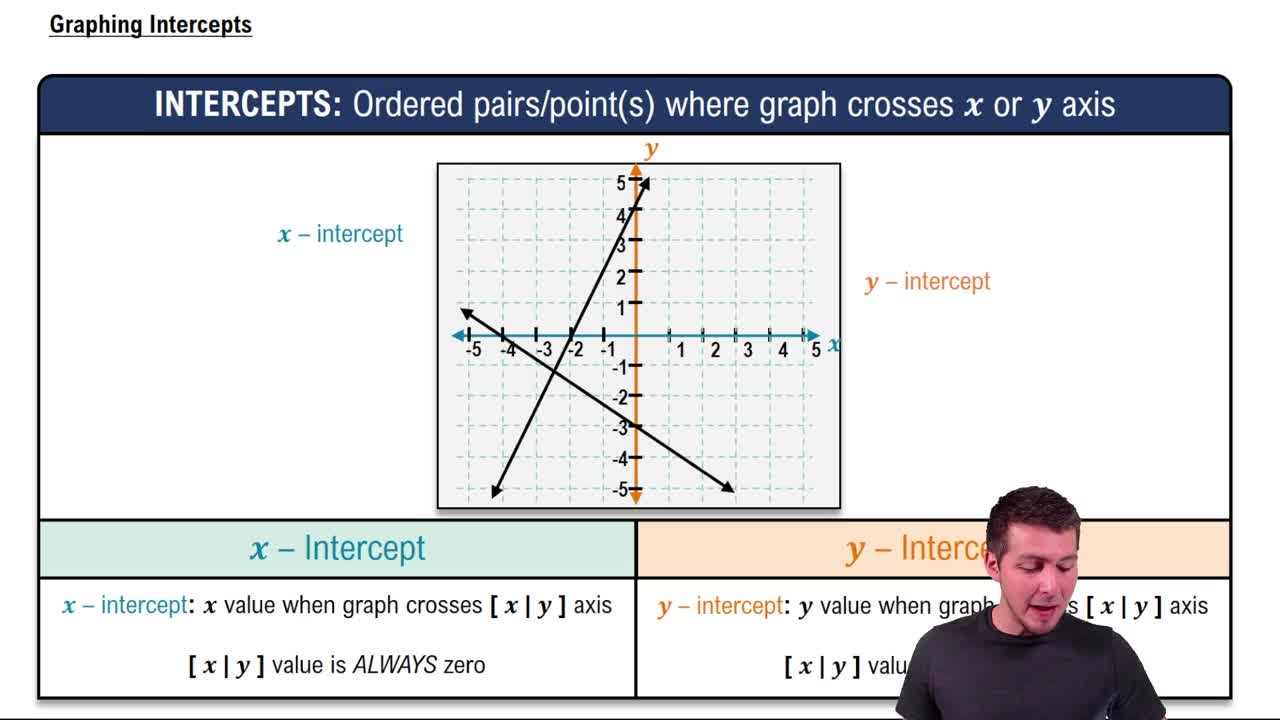
Graphing Intercepts

Y-Intercepts

Y-intercepts are the points where a graph crosses the y-axis. At these points, the value of x is zero. To determine the y-intercept of a function, you evaluate the function at x = 0. For quadratic functions, this is simply the constant term when the function is expressed in standard form.
Video consigliato:
04:08
Graphing Intercepts

Quadratic Functions

Quadratic functions are polynomial functions of degree two, typically expressed in the form f(x) = ax² + bx + c, where a, b, and c are constants. The graph of a quadratic function is a parabola, which can open upwards or downwards depending on the sign of the coefficient 'a'. Understanding the shape and properties of parabolas is essential for analyzing their intercepts.
Video consigliato:
06:36
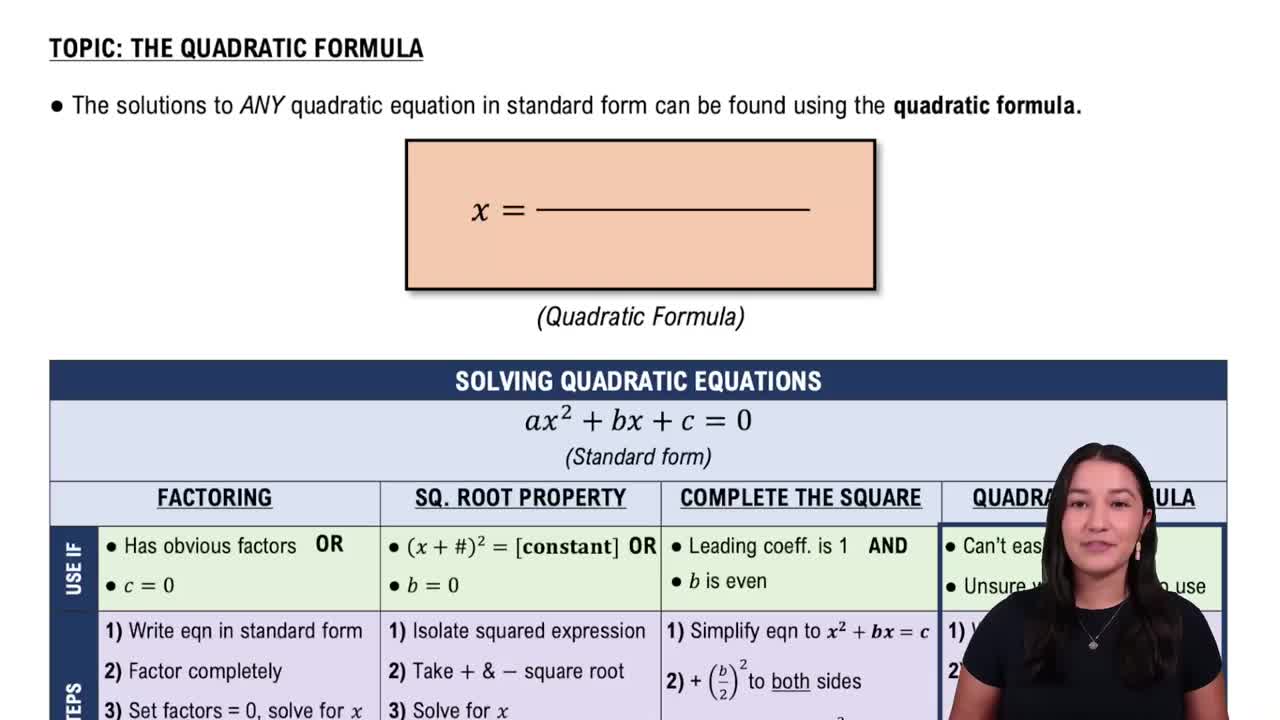
Solving Quadratic Equations Using The Quadratic Formula