Solve each equation in Exercises 41–60 by making an appropriate substitution.
Ch. 1 - Equations and Inequalities

Capitolo 2, Problema 51a
Write each English sentence as an equation in two variables. Then graph the equation. y = 5 (Let x = -3, - 2, - 1, 0, 1, 2, and 3.)
Guida verificata passo dopo passo1
Step 1: Understand the problem. The given equation is y = 5, which is a horizontal line because the value of y is constant regardless of the value of x. This means that for any x-value, y will always equal 5.
Step 2: Identify the x-values to use for graphing. The problem specifies that x = -3, -2, -1, 0, 1, 2, and 3. These are the x-coordinates for the points we will plot.
Step 3: Calculate the corresponding y-values for each x-value. Since y = 5 for all x-values, the y-coordinate for each point will be 5. This gives the points (-3, 5), (-2, 5), (-1, 5), (0, 5), (1, 5), (2, 5), and (3, 5).
Step 4: Plot the points on a coordinate plane. Place each point on the graph using the x and y coordinates calculated in the previous step. For example, plot (-3, 5), then (-2, 5), and so on.
Step 5: Draw the graph. Connect the points with a straight horizontal line, as the equation y = 5 represents a horizontal line where y is always 5, regardless of x.

Risposta video verificata per un problema simile:
Questa soluzione video è stata consigliata dai nostri tutor come utile per risolvere questo problema.
Durata del video:
2mConcetti chiave
Ecco i concetti essenziali che devi comprendere per rispondere correttamente alla domanda.
Linear Equations
A linear equation in two variables is an equation that can be expressed in the form y = mx + b, where m represents the slope and b represents the y-intercept. This type of equation describes a straight line when graphed on a coordinate plane. Understanding the structure of linear equations is essential for translating English sentences into mathematical expressions.
Video consigliato:
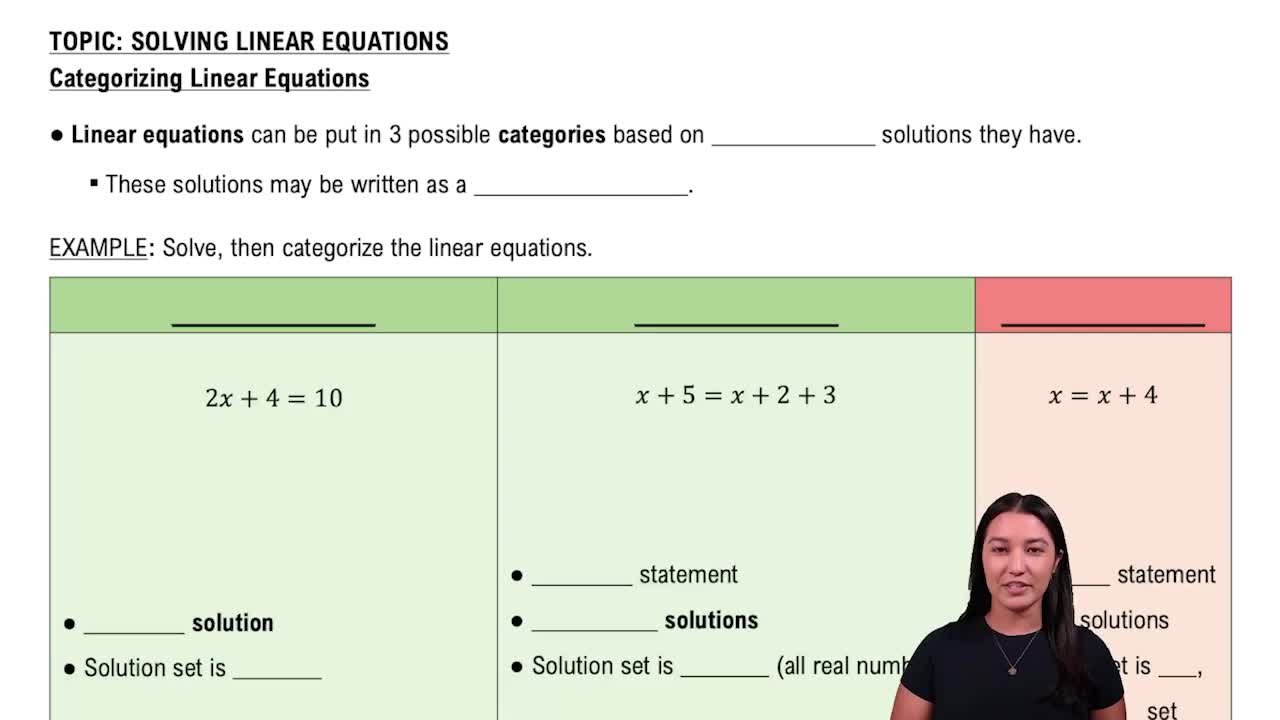
Categorizing Linear Equations
Graphing Linear Equations
Graphing a linear equation involves plotting points on a coordinate plane that satisfy the equation. For the equation y = 5, the value of y is constant regardless of x, resulting in a horizontal line at y = 5. Knowing how to plot points and draw lines based on the equation is crucial for visualizing the relationship between the variables.
Video consigliato:
Categorizing Linear Equations
Substituting Values
Substituting values into an equation means replacing the variable with specific numbers to find corresponding outputs. In this case, substituting x values of -3, -2, -1, 0, 1, 2, and 3 into the equation y = 5 will yield the same output for y, demonstrating the concept of a function where y remains constant. This process is fundamental for generating points to graph the equation.
Video consigliato:
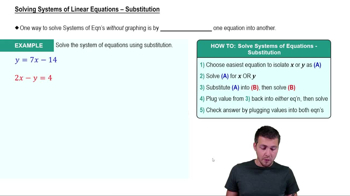
Solving Systems of Equations - Substitution
Pratica correlata
Domanda del libro di testo
593
views
Domanda del libro di testo
In Exercises 37–52, perform the indicated operations and write the result in standard form. (3√-5)(- 4√-12)
174
views
Domanda del libro di testo
Solve each equation in Exercises 47–64 by completing the square.
965
views
Domanda del libro di testo
In Exercises 35–54, solve each formula for the specified variable. Do you recognize the formula? If so, what does it describe? A = 2lw + 2lh + 2wh for h
665
views
Domanda del libro di testo
In Exercises 51–58, solve each compound inequality. 6 < x + 3 < 8
1161
views
Domanda del libro di testo
Exercises 41–60 contain rational equations with variables in denominators. For each equation, a. write the value or values of the variable that make a denominator zero. These are the restrictions on the variable. b. Keeping the restrictions in mind, solve the equation. 2/(x - 2) = x/(x - 2) - 2
841
views