Ch. 2 - Functions and Graphs
Blitzer - College Algebra 8th Edition
Blitzer8th EditionCollege AlgebraISBN: 9780136970514Non è quello che usi tu?Cambia libro di testo
Capitolo 3, Problema 46

Give the slope and y-intercept of each line whose equation is given. Then graph the linear function. y = -2x/5+6

Guida verificata passo dopo passo
1
Identify the given linear equation: \(y = -\frac{2x}{5} + 6\).
Rewrite the equation in slope-intercept form $y = mx + b$, where \(m\) is the slope and \(b\) is the y-intercept. Here, the equation is already in this form with \(m = -\frac{2}{5}\) and \(b = 6\).
Determine the slope \(m = -\frac{2}{5}\), which means the line falls 2 units vertically for every 5 units it moves horizontally to the right.
Identify the y-intercept \(b = 6\), which is the point where the line crosses the y-axis, at \((0, 6)\).
To graph the line, start by plotting the y-intercept \((0, 6)\) on the coordinate plane, then use the slope to find another point by moving 5 units to the right and 2 units down, and draw the line through these points.

Risposta video verificata per un problema simile:

Questa soluzione video è stata consigliata dai nostri tutor come utile per risolvere questo problema.
Durata del video:
2m

Concetti chiave

Ecco i concetti essenziali che devi comprendere per rispondere correttamente alla domanda.

Slope of a Linear Function

The slope represents the rate of change of the function and indicates how steep the line is. It is the coefficient of x in the equation y = mx + b, where m is the slope. A negative slope means the line decreases as x increases.
Video consigliato:
06:07
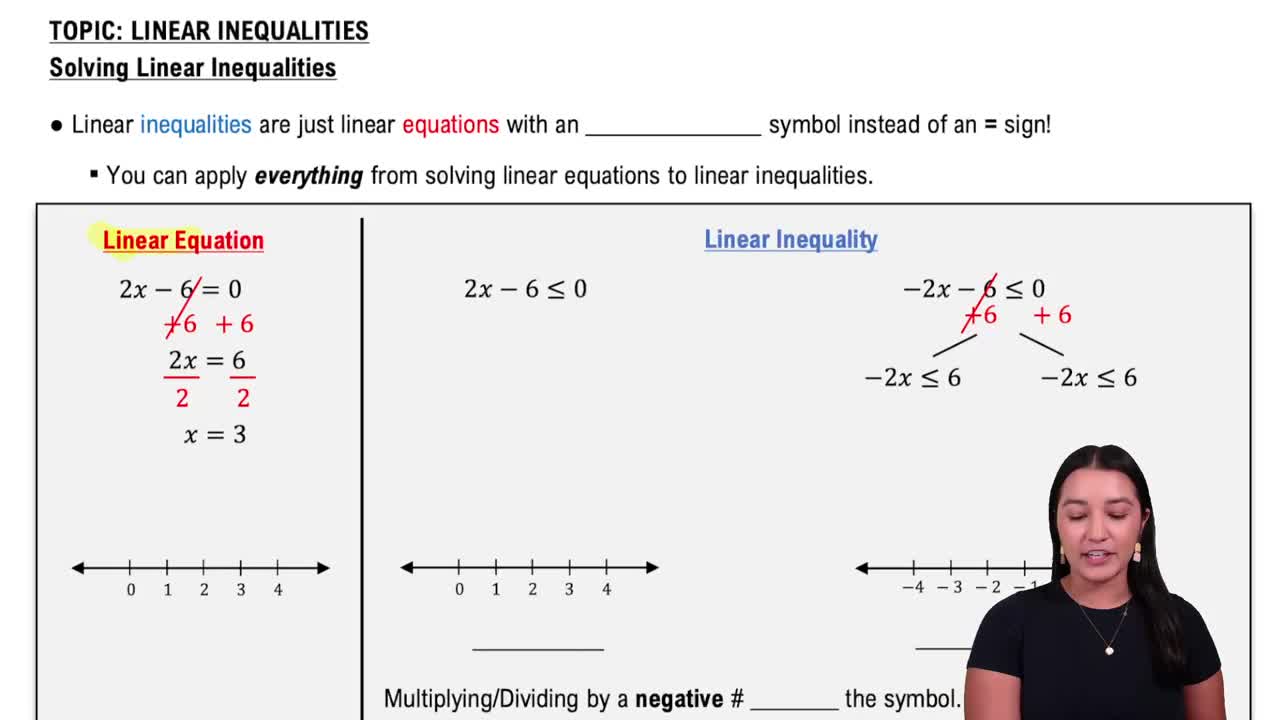
Linear Inequalities

Y-Intercept of a Linear Function

The y-intercept is the point where the line crosses the y-axis, given by the constant term b in y = mx + b. It shows the value of y when x is zero and helps in graphing the line accurately.
Video consigliato:
06:07
Linear Inequalities

Graphing Linear Functions

Graphing involves plotting the y-intercept on the coordinate plane and using the slope to find other points by rising and running from the intercept. Connecting these points forms the line representing the function.
Video consigliato:
5:26
Graphs of Logarithmic Functions