Ch. 2 - Functions and Graphs
Blitzer - College Algebra 8th Edition
Blitzer8th EditionCollege AlgebraISBN: 9780136970514Non è quello che usi tu?Cambia libro di testo
Capitolo 3, Problema 49

Graph each equation in a rectangular coordinate system. y = -2

Guida verificata passo dopo passo
1
Identify the type of equation given. The equation \(y = -2\) represents a horizontal line because \(y\) is constant for all values of \(x\).
Understand that for any value of \(x\), the value of \(y\) will always be \(-2\). This means the line is parallel to the \(x\)-axis.
To graph the line, plot several points where \(y = -2\). For example, points like \((0, -2)\), \((1, -2)\), and \((-1, -2)\) all lie on the line.
Draw a straight horizontal line through all these points extending across the coordinate plane.
Label the line with its equation \(y = -2\) to clearly indicate which line you have graphed.

Risposta video verificata per un problema simile:

Questa soluzione video è stata consigliata dai nostri tutor come utile per risolvere questo problema.
Durata del video:
1m

Concetti chiave

Ecco i concetti essenziali che devi comprendere per rispondere correttamente alla domanda.

Graphing Horizontal Lines

A horizontal line in the coordinate plane has the same y-value for all x-values. The equation y = -2 represents a horizontal line crossing the y-axis at -2, meaning every point on the line has y-coordinate -2 regardless of x.
Video consigliato:
02:35
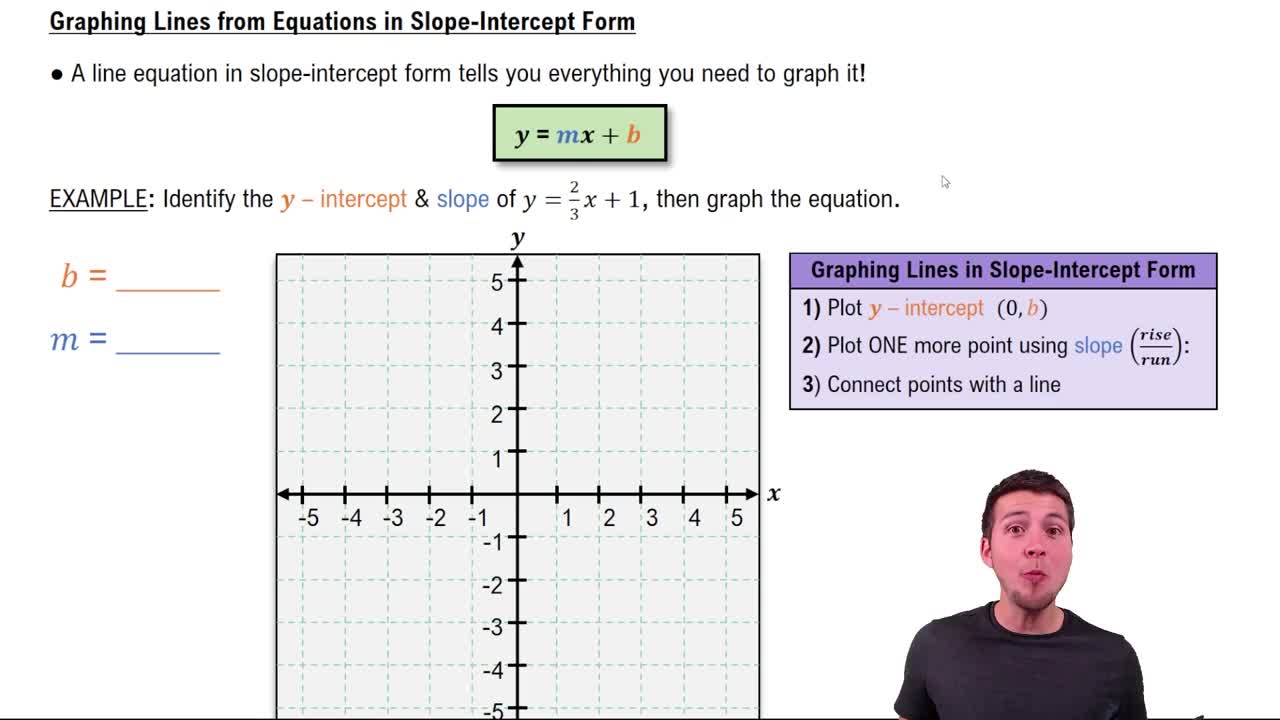
Graphing Lines in Slope-Intercept Form

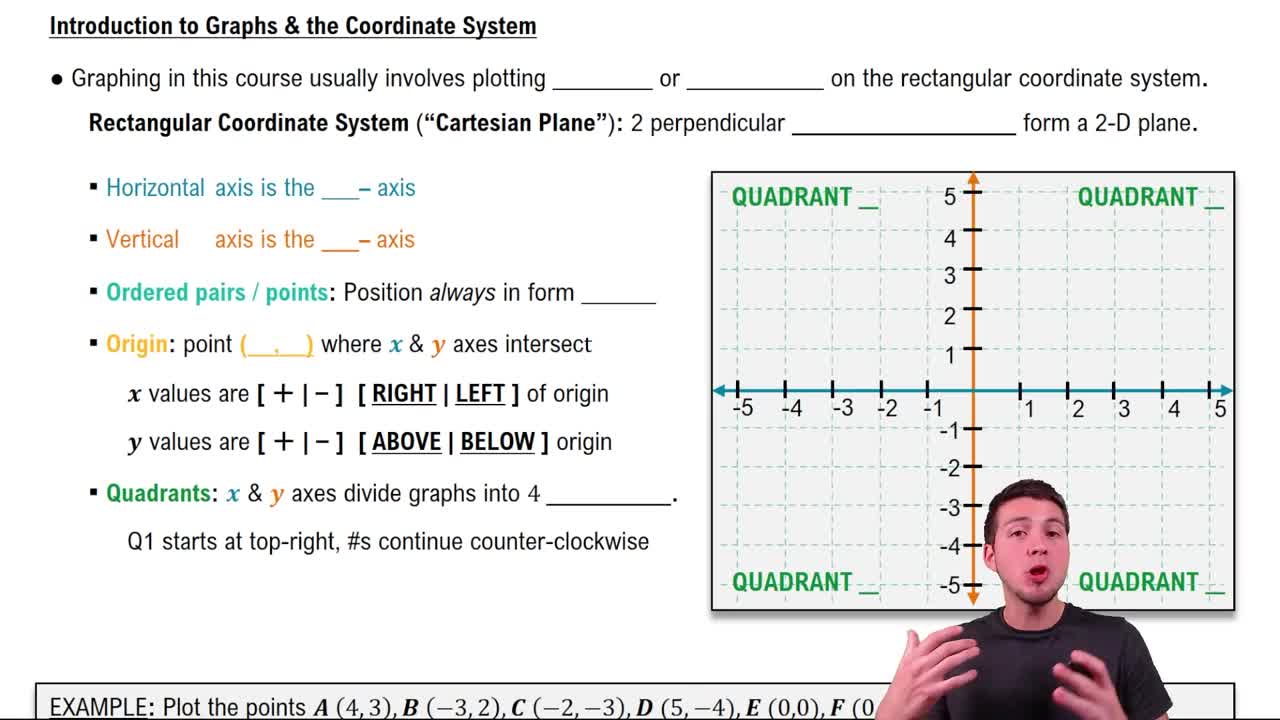
Rectangular Coordinate System

The rectangular coordinate system consists of two perpendicular axes: the x-axis (horizontal) and the y-axis (vertical). Points are located using ordered pairs (x, y), where x is the horizontal position and y is the vertical position.
Video consigliato:
05:10
Graphs & the Rectangular Coordinate System

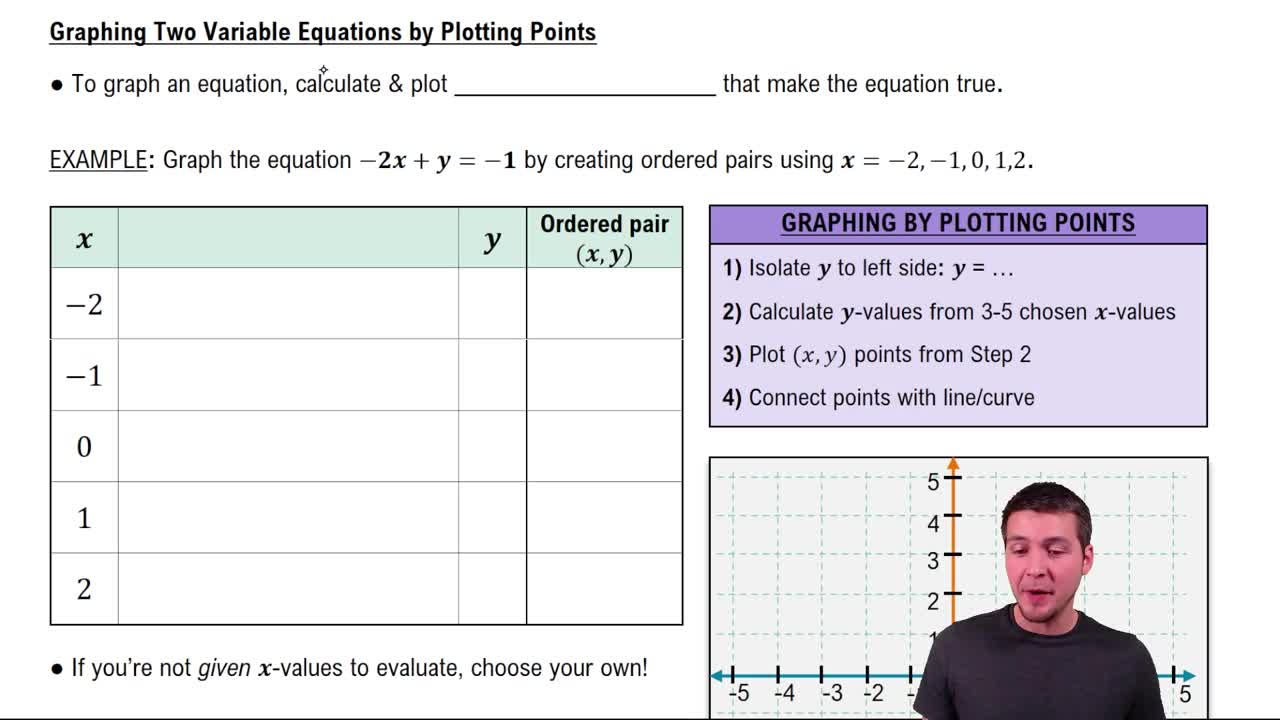
Plotting Points from an Equation

To graph an equation, identify points that satisfy it by substituting values for variables. For y = -2, choose any x-values and plot points with y fixed at -2, then connect these points to form the line.
Video consigliato:
04:29
Graphing Equations of Two Variables by Plotting Points