Complete the square and write the equation in standard form. Then give the center and radius of each circle and graph the equation. x² + y²+3x+5y+9/4=0
Ch. 2 - Functions and Graphs

Capitolo 3, Problema 63
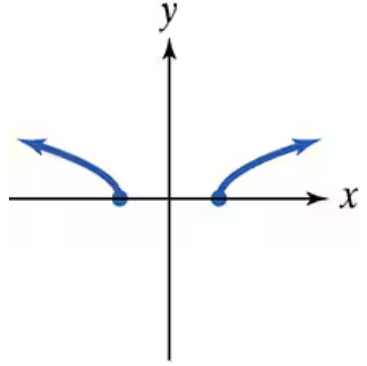
Use the vertical line test to identify graphs in which y is a function of x.

Guida verificata passo dopo passo1
Recall the vertical line test: A graph represents y as a function of x if and only if no vertical line intersects the graph at more than one point.
Examine the blue curve on the left side of the graph. Imagine drawing vertical lines at various x-values along this curve and observe if any vertical line crosses the curve more than once.
Do the same for the orange curve on the right side of the graph, checking if any vertical line intersects it at more than one point.
If for a given curve, every vertical line intersects it at most once, then y is a function of x for that curve.
Based on your observations, conclude which of the two curves (blue or orange) represents y as a function of x.

Risposta video verificata per un problema simile:
Questa soluzione video è stata consigliata dai nostri tutor come utile per risolvere questo problema.
Durata del video:
58sConcetti chiave
Ecco i concetti essenziali che devi comprendere per rispondere correttamente alla domanda.
Vertical Line Test
The vertical line test is a visual method used to determine if a graph represents a function. If any vertical line drawn through the graph intersects it at more than one point, the graph does not represent a function. This test ensures that each input (x-value) corresponds to exactly one output (y-value).
Video consigliato:
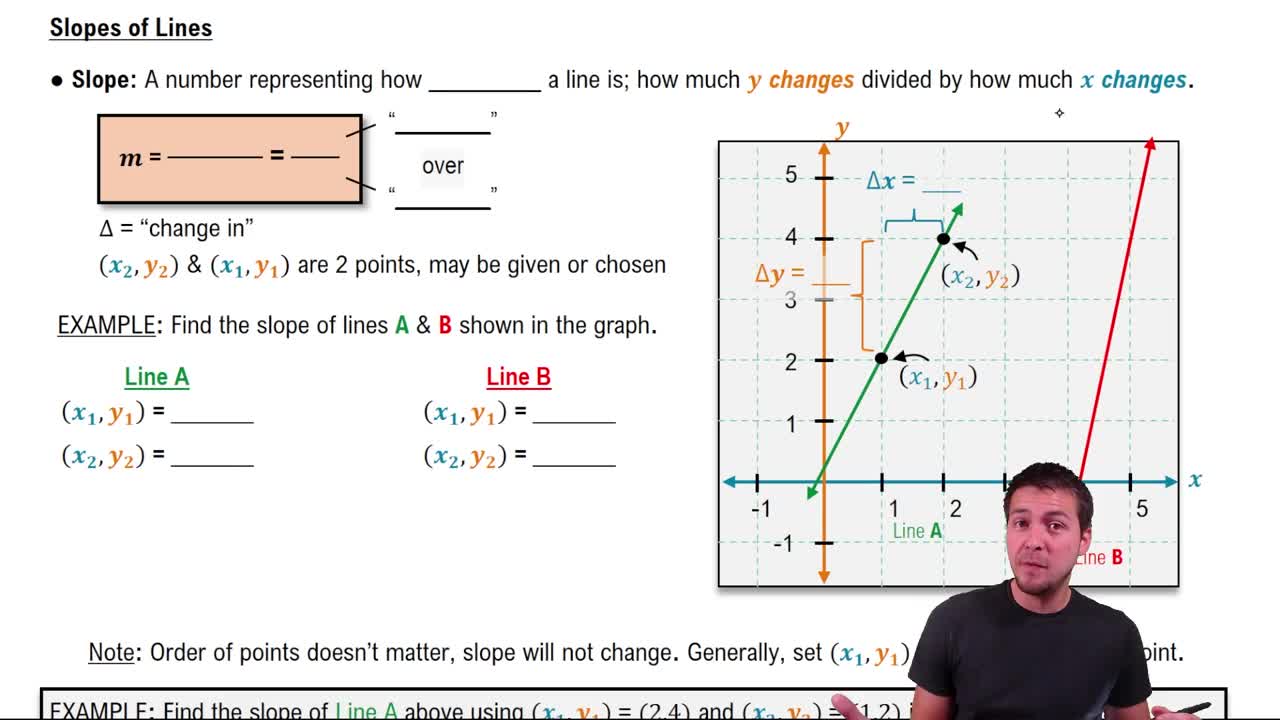
The Slope of a Line
Definition of a Function
A function is a relation where each input value (x) has exactly one output value (y). This means no x-value can be paired with multiple y-values. Understanding this definition is crucial to applying the vertical line test and interpreting graphs correctly.
Video consigliato:
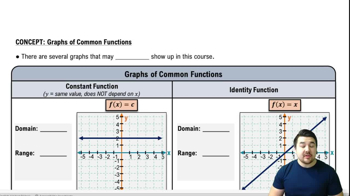
Graphs of Common Functions
Graph Interpretation and Coordinate Plane
Interpreting graphs involves understanding the coordinate plane, where the horizontal axis represents x-values and the vertical axis represents y-values. Recognizing how curves behave and their position relative to the axes helps in applying tests like the vertical line test to determine function status.
Video consigliato:
Graphs and Coordinates - Example
Pratica correlata
Domanda del libro di testo
813
views
Domanda del libro di testo
In Exercises 59-64, let f(x) = 2x - 5 g(x) = 4x - 1 h(x) = x² + x + 2. Evaluate the indicated function without finding an equation for the function. g (f[h (1)])
1154
views
Domanda del libro di testo
In Exercises 59-66, a. Rewrite the given equation in slope-intercept form. b. Give the slope and y-intercept. c. Use the slope and y-intercept to graph the linear function. 8x – 4y – 12 =0
162
views
Domanda del libro di testo
Let f(x) = 2x - 5 g(x) = 4x - 1 h(x) = x² + x + 2. Evaluate the indicated function without finding an equation for the function. f(g[h (1)])
819
views
Domanda del libro di testo
Find a. (fog) (x) b. (go f) (x) c. (fog) (2) d. (go f) (2).
f(x) = 2x-3, g(x) = (x+3)/2
1012
views
Domanda del libro di testo
Begin by graphing the standard quadratic function, f(x) = x². Then use transformations of this graph to graph the given function. g(x) = (1/2)(x − 1)²
868
views