Complete the square and write the equation in standard form. Then give the center and radius of each circle and graph the equation. x² + y² - 6y -7=0
Ch. 2 - Functions and Graphs

Capitolo 3, Problema 60
In Exercises 59-66, a. Rewrite the given equation in slope-intercept form. b. Give the slope and y-intercept. c. Use the slope and y-intercept to graph the linear function. 4x+y-6=0
Guida verificata passo dopo passo1
Start with the given equation: \(4x + y - 6 = 0\).
Rewrite the equation to solve for \(y\) in terms of \(x\) to get it into slope-intercept form $y = mx + b$. To do this, isolate \(y\) by subtracting \$4x$ and adding \(6\) to both sides: $y = -4x + 6$.
Identify the slope \(m\) and the y-intercept \(b\) from the slope-intercept form $y = mx + b$. Here, the slope \(m\) is the coefficient of \(x\), which is \(-4\), and the y-intercept \(b\) is the constant term, which is \(6\).
To graph the linear function, start by plotting the y-intercept point \((0, 6)\) on the coordinate plane.
Use the slope \(m = -4\) to find another point. Since slope is rise over run, from the y-intercept move down 4 units (rise = -4) and right 1 unit (run = 1) to plot a second point. Then draw a straight line through these two points to complete the graph.

Risposta video verificata per un problema simile:
Questa soluzione video è stata consigliata dai nostri tutor come utile per risolvere questo problema.
Durata del video:
5mConcetti chiave
Ecco i concetti essenziali che devi comprendere per rispondere correttamente alla domanda.
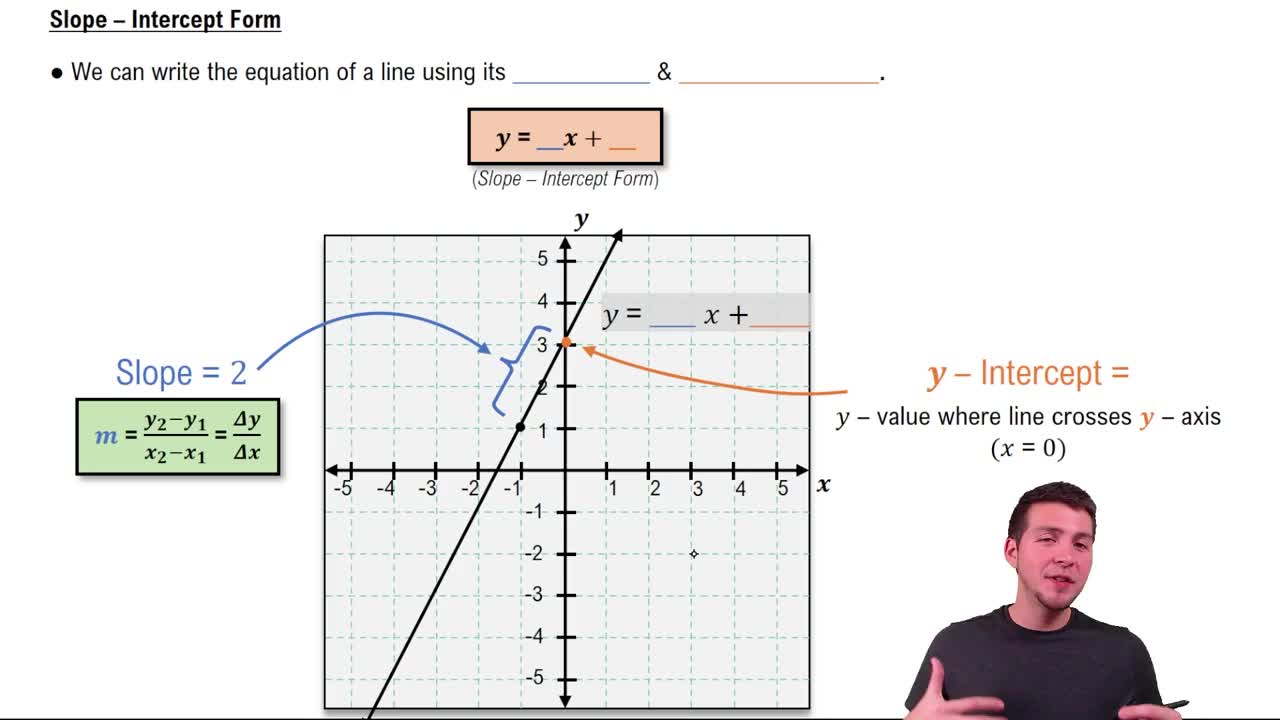
Slope-Intercept Form
The slope-intercept form of a linear equation is y = mx + b, where m represents the slope and b represents the y-intercept. Rewriting an equation into this form makes it easier to identify these values and to graph the line.
Video consigliato:
Slope-Intercept Form
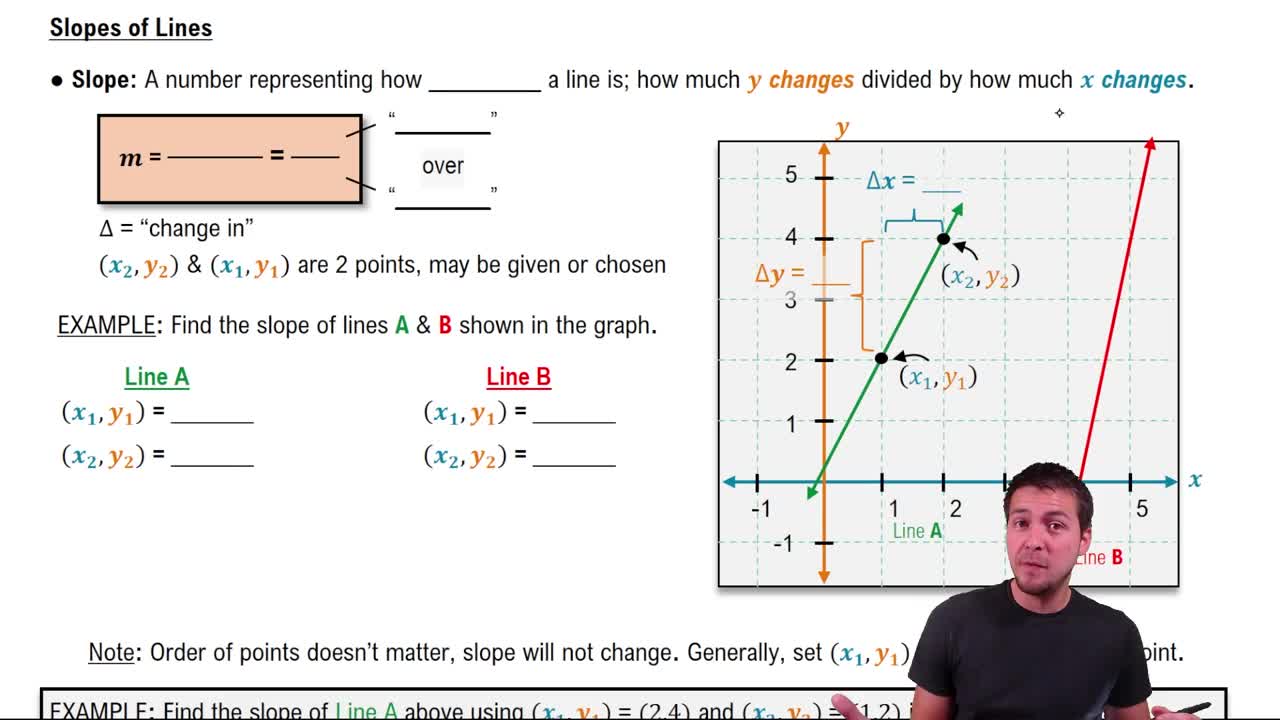
Slope of a Line
The slope (m) measures the steepness and direction of a line, calculated as the ratio of the change in y to the change in x (rise over run). It indicates how much y changes for a unit change in x and is essential for understanding the line's behavior.
Video consigliato:
The Slope of a Line
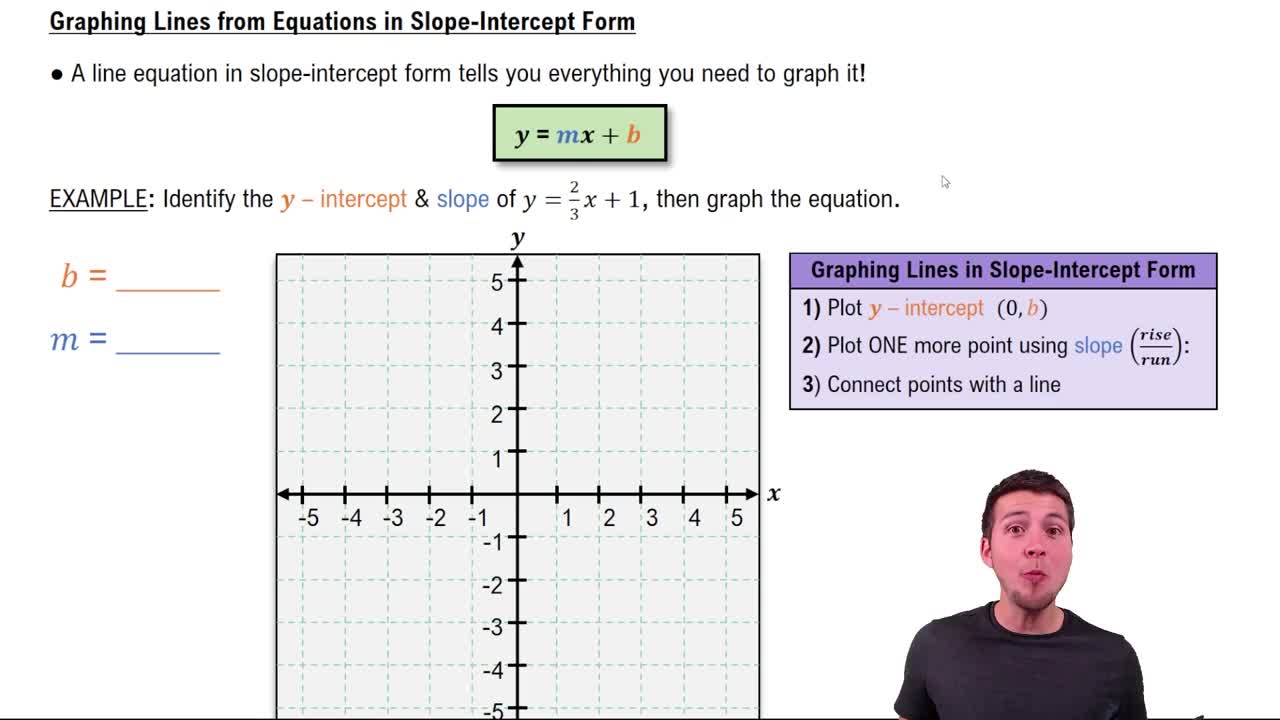
Graphing Using Slope and Y-Intercept
Graphing a linear function involves plotting the y-intercept (where the line crosses the y-axis) and then using the slope to find other points by moving vertically and horizontally. This method provides a straightforward way to visualize the line on the coordinate plane.
Video consigliato:
Graphing Lines in Slope-Intercept Form
Pratica correlata
Domanda del libro di testo
889
views
Domanda del libro di testo
In Exercises 55–64, use the vertical line test to identify graphs in which y is a function of x.
125
views
Domanda del libro di testo
Let f(x) = 2x - 5 g(x) = 4x - 1 h(x) = x² + x + 2. Evaluate the indicated function without finding an equation for the function. ƒ-1 (1)
599
views
Domanda del libro di testo
In Exercises 60–63, begin by graphing the standard quadratic function, f(x) = x^2. Then use transformations of this graph to graph the given function. g(x) = x^2 + 2
988
views
Domanda del libro di testo
Use the vertical line test to identify graphs in which y is a function of x.
129
views
Domanda del libro di testo
Complete the square and write the equation in standard form. Then give the center and radius of each circle and graph the equation. x² + y² − x + 2y + 1 = 0
856
views