Ch. 2 - Functions and Graphs
Blitzer - College Algebra 8th Edition
Blitzer8th EditionCollege AlgebraISBN: 9780136970514Non è quello che usi tu?Cambia libro di testo
Capitolo 3, Problema 80

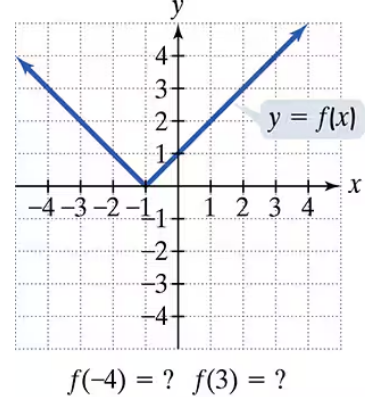
In Exercises 77–92, use the graph to determine a. the function's range; b. the y-intercept, if any; and e. the missing function values, indicated by question marks, below each graph.

Guida verificata passo dopo passo
1
Step 1: Identify the range of the function by looking at the y-values covered by the graph. The graph starts at the point (0, 4) and goes down to (4, 0), so the y-values range from 0 to 4, inclusive of 0 but exclusive of 4 because the point (4, 0) is an open circle on the x-axis.
Step 2: Determine the y-intercept by finding where the graph crosses the y-axis. The graph crosses the y-axis at the point (0, 4), so the y-intercept is 4.
Step 3: To find the missing function values indicated by question marks, observe the x-values given and use the graph to find the corresponding y-values. For example, if you need the function value at x = 2, locate x = 2 on the x-axis and find the y-value on the curve directly above or below it.
Step 4: Note that the graph is a curve that appears to be part of a circle or a similar shape, so the function might be defined by an equation involving a square root or a quadratic expression. Use the known points (0, 4) and (4, 0) to help determine the function's formula if needed.
Step 5: Verify the function values by checking if they lie on the curve between the points (0, 4) and (4, 0), ensuring the values are consistent with the shape and domain of the function.

Risposta video verificata per un problema simile:

Questa soluzione video è stata consigliata dai nostri tutor come utile per risolvere questo problema.
Durata del video:
3m

Concetti chiave

Ecco i concetti essenziali che devi comprendere per rispondere correttamente alla domanda.

Function Range

The range of a function is the set of all possible output values (y-values) that the function can produce. To find the range from a graph, identify the lowest and highest points on the curve along the y-axis. In this graph, the range includes all y-values from 0 to 4, inclusive of 4 but not including 0 at x=4 due to the open circle.
Video consigliato:
4:22
Domain & Range of Transformed Functions

Y-Intercept

The y-intercept is the point where the graph crosses the y-axis, representing the function value when x = 0. It is found by locating the point on the graph with an x-coordinate of zero. Here, the y-intercept is at (0, 4), indicating the function's value is 4 when x is zero.
Video consigliato:
04:08
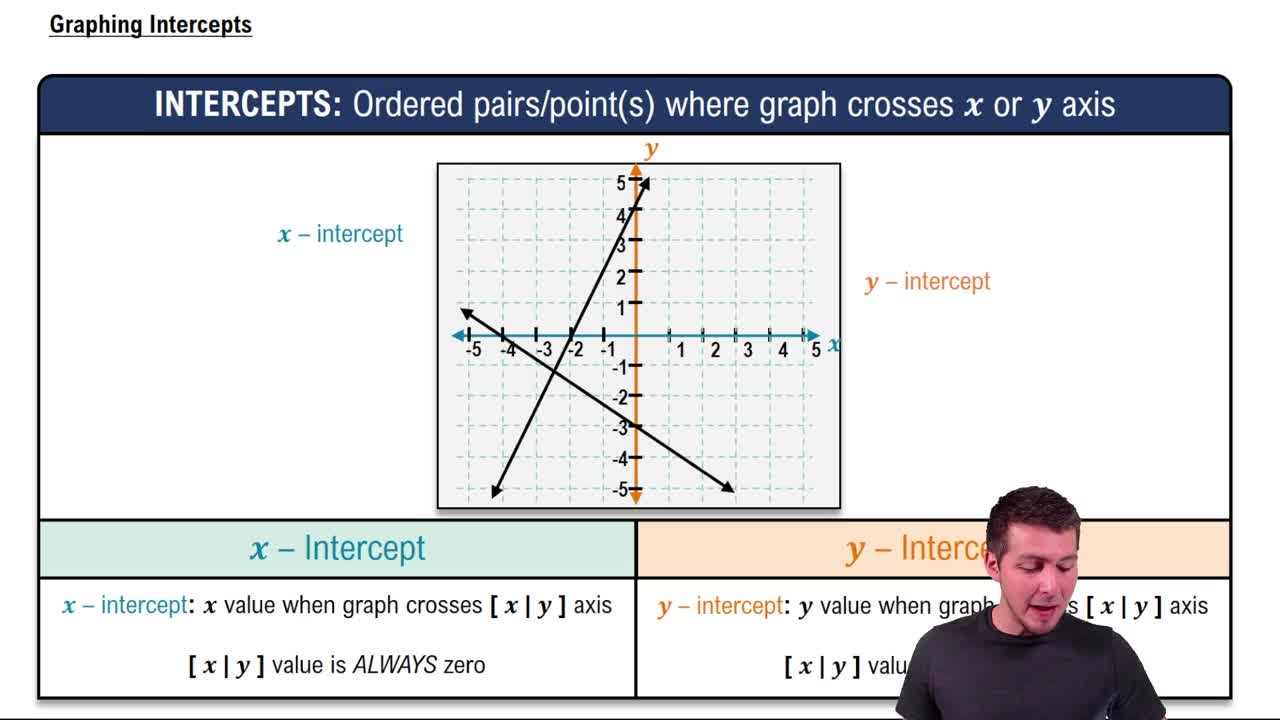
Graphing Intercepts

Interpreting Open and Closed Points on Graphs

Open and closed points on a graph indicate whether a function value is included or excluded at that point. A closed dot means the value is included, while an open circle means it is excluded. In this graph, the open circle at (4, 0) shows the function does not include the value 0 at x = 4, affecting the range and function values.
Video consigliato:
04:29
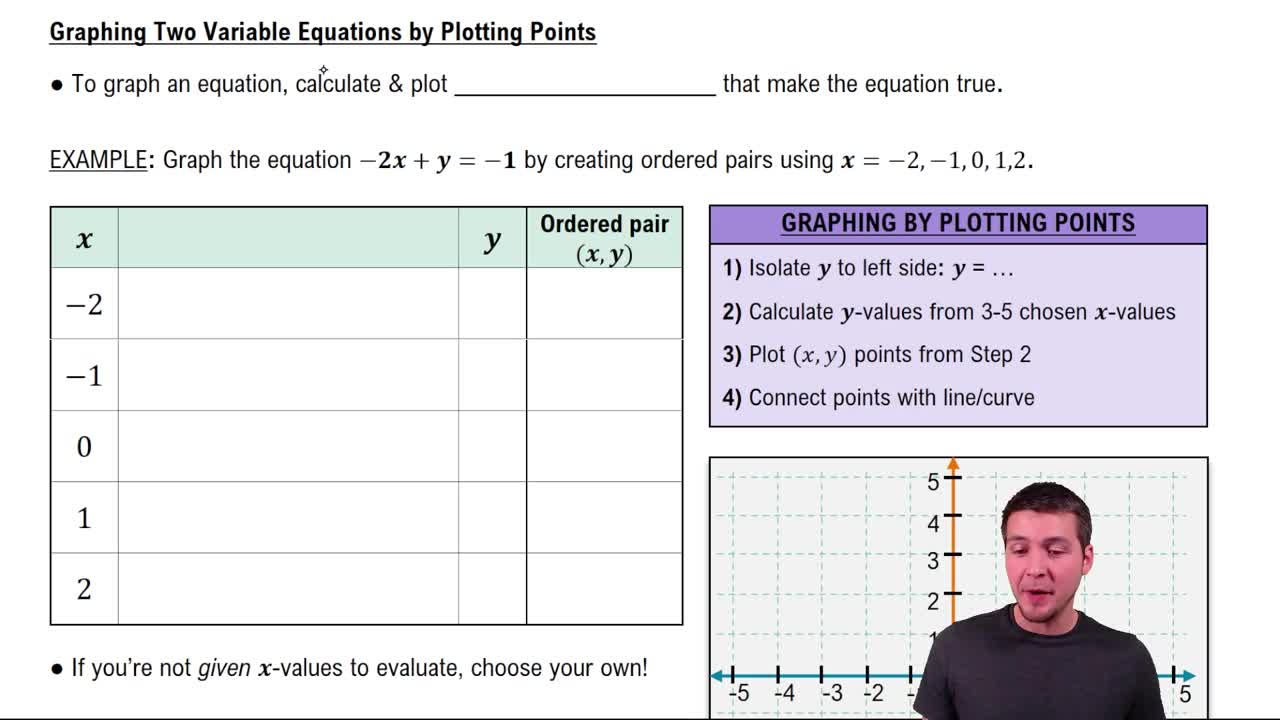
Graphing Equations of Two Variables by Plotting Points