Begin by graphing the standard cubic function, f(x) = x³. Then use transformations of this graph to graph the given function. r(x) = (x − 2)³ +1
Ch. 2 - Functions and Graphs

Capitolo 3, Problema 102
Solve and graph the solution set on a number line: 3|2x-1| ≥ 21
Guida verificata passo dopo passo1
Start by isolating the absolute value expression. Divide both sides of the inequality \(3|2x - 1| \geq 21\) by 3 to get \(|2x - 1| \geq 7\).
Recall that for an absolute value inequality \(|A| \geq B\) (where \(B > 0\)), the solution splits into two cases: \(A \geq B\) or \(A \leq -B\).
Apply this to \(|2x - 1| \geq 7\), which gives two inequalities: \(2x - 1 \geq 7\) and \(2x - 1 \leq -7\).
Solve each inequality separately: For \(2x - 1 \geq 7\), add 1 to both sides and then divide by 2. For \(2x - 1 \leq -7\), add 1 to both sides and then divide by 2.
Express the solution set as the union of the two intervals found, and then graph these intervals on a number line, using closed circles to indicate that the endpoints are included.

Risposta video verificata per un problema simile:
Questa soluzione video è stata consigliata dai nostri tutor come utile per risolvere questo problema.
Durata del video:
2mConcetti chiave
Ecco i concetti essenziali che devi comprendere per rispondere correttamente alla domanda.
Absolute Value Inequalities
Absolute value inequalities involve expressions where the absolute value of a variable or expression is compared to a number. To solve them, consider the definition of absolute value as distance from zero, leading to two cases: one where the expression inside is greater than or equal to the positive value, and one where it is less than or equal to the negative value.
Video consigliato:
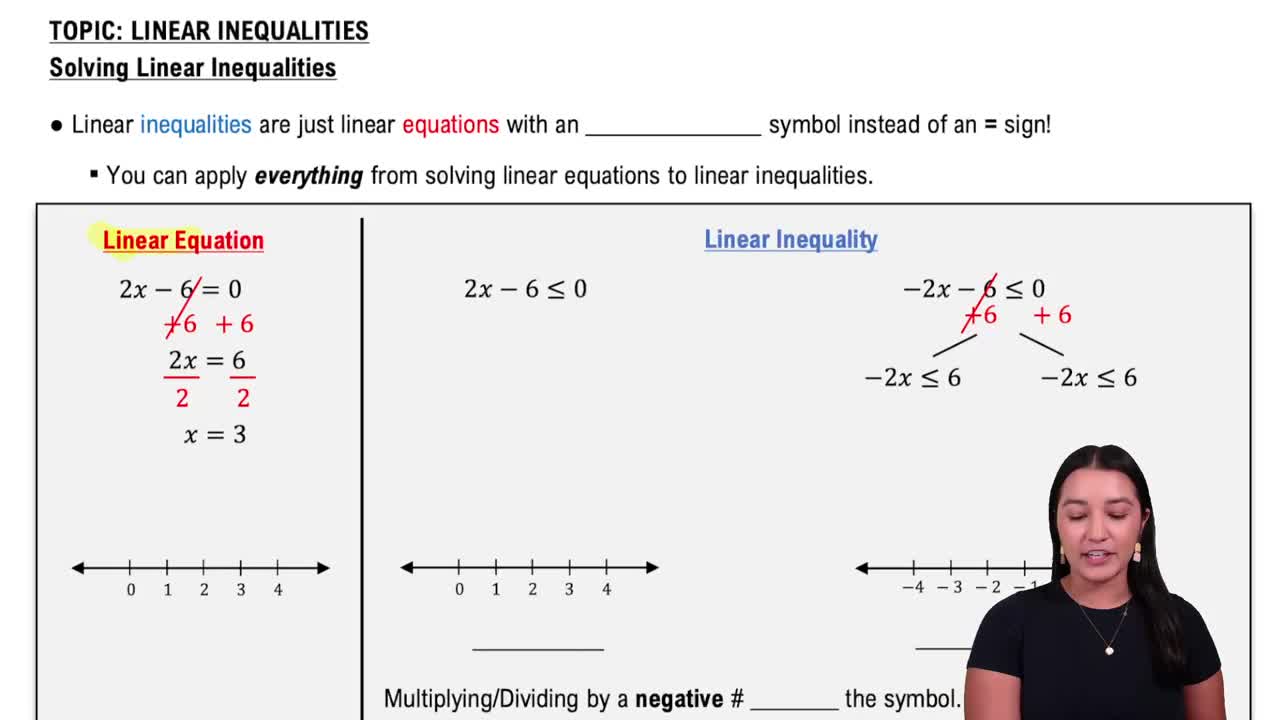
Linear Inequalities
Isolating the Absolute Value Expression
Before solving an absolute value inequality, isolate the absolute value term on one side of the inequality. This often involves dividing or subtracting terms to simplify the inequality, making it easier to apply the definition of absolute value and split into separate inequalities.
Video consigliato:
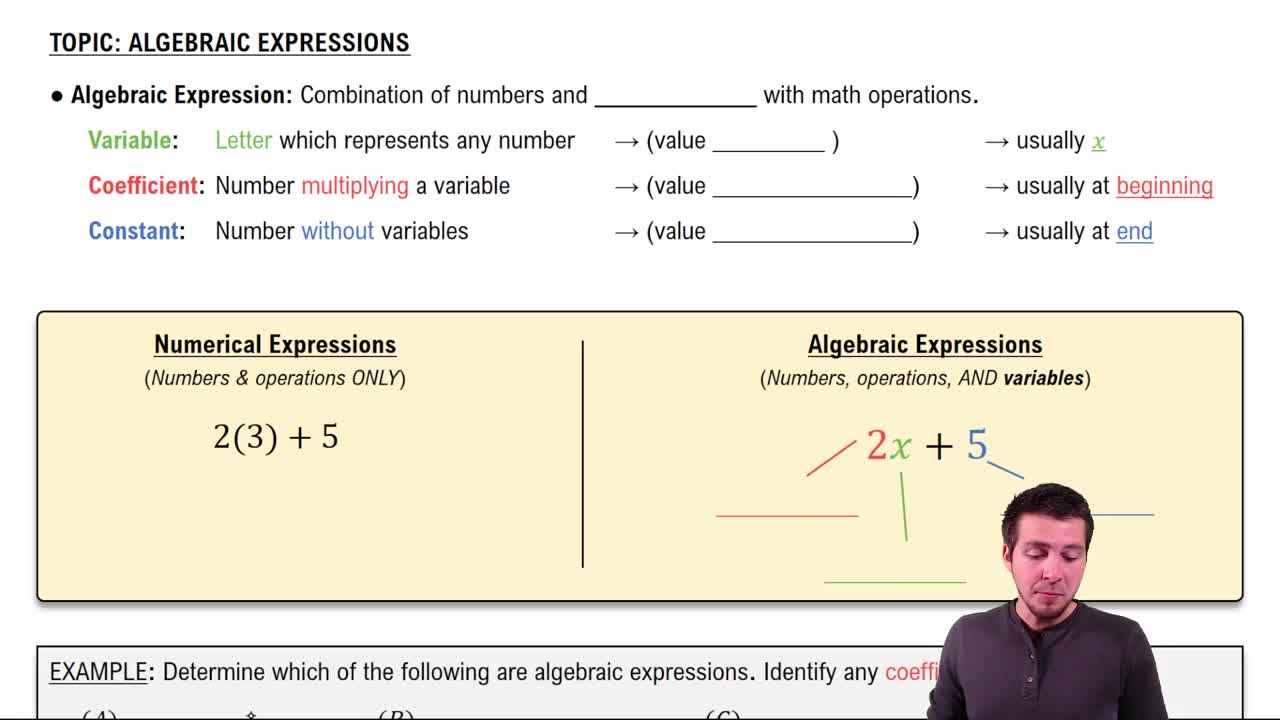
Introduction to Algebraic Expressions
Graphing Solution Sets on a Number Line
Graphing the solution set involves representing all values of the variable that satisfy the inequality on a number line. Use open or closed circles to indicate whether endpoints are included, and shade the regions that represent the solution intervals, helping visualize the range of possible values.
Video consigliato:
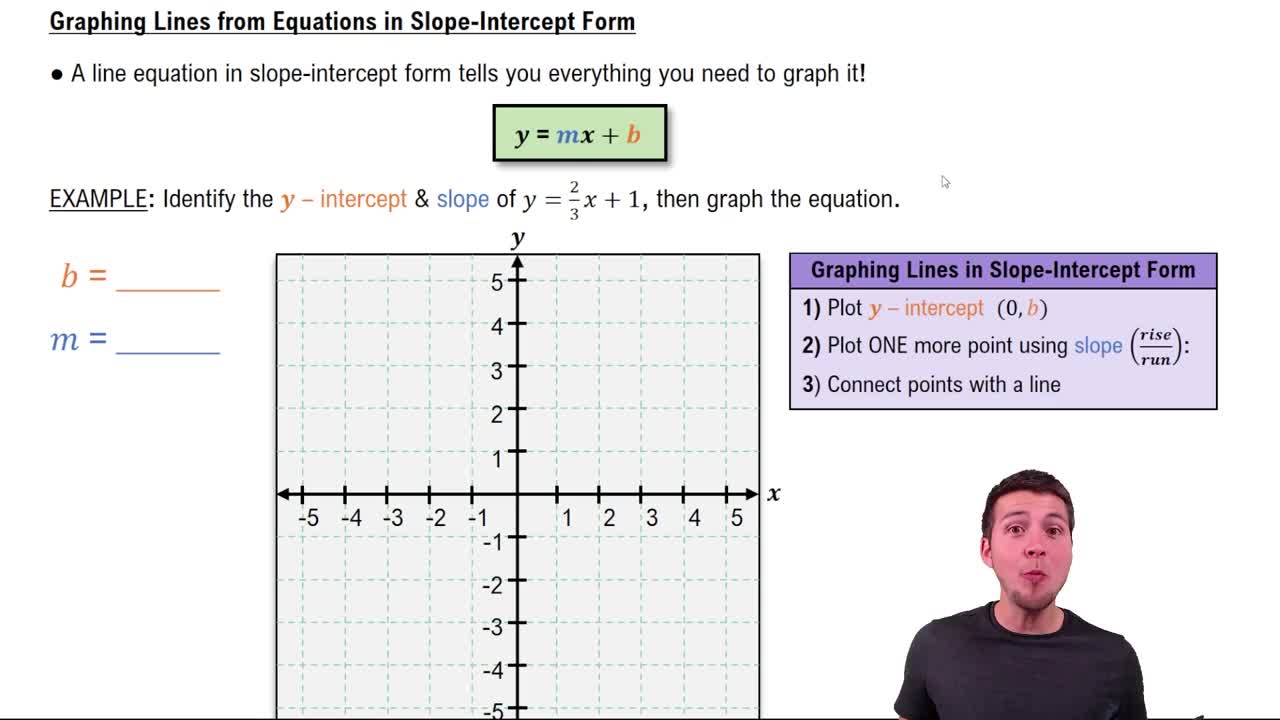
Graphing Lines in Slope-Intercept Form
Pratica correlata
Domanda del libro di testo
714
views
Domanda del libro di testo
In Exercises 101–102, find an equation for f^(-1)(x). Then graph f and f^(-1) in the same rectangular coordinate system. f(x) = 1 - x^2, x ≥ 0.
713
views
Domanda del libro di testo
Exercises 103–105 will help you prepare for the material covered in the next section. Let (x1, y₁) = (7, 2) and (x2, y2) = (1, −1). Find √[(x2 − x1)² + (y2 − y₁)²]. Express the - answer in simplified radical form.
748
views
Domanda del libro di testo
Solve: 5x3/4- 15 = 0.
689
views
Domanda del libro di testo
Begin by graphing the standard cubic function, f(x) = x³. Then use transformations of this graph to graph the given function. h(x) = x³/2
1031
views
Domanda del libro di testo
Exercises 103–105 will help you prepare for the material covered in the next section. Use a rectangular coordinate system to graph the circle with center (1, -1) and radius 1.
817
views