Ch. 3 - Polynomial and Rational Functions
Blitzer - College Algebra 8th Edition
Blitzer8th EditionCollege AlgebraISBN: 9780136970514Non è quello che usi tu?Cambia libro di testo
Capitolo 4, Problema 37

In Exercises 17–38, use the vertex and intercepts to sketch the graph of each quadratic function. Give the equation of the parabola's axis of symmetry. Use the graph to determine the function's domain and range. f(x)=2x−x2−2

Guida verificata passo dopo passo
1
Rewrite the function in standard quadratic form: \(f(x) = -x^{2} + 2x - 2\).
Find the vertex using the formula for the x-coordinate of the vertex: \(x = -\frac{b}{2a}\), where \(a = -1\) and \(b = 2\).
Calculate the y-coordinate of the vertex by substituting the x-value back into the function: \(f(x) = -x^{2} + 2x - 2\).
Find the y-intercept by evaluating \(f(0)\), and find the x-intercepts by solving the equation \(-x^{2} + 2x - 2 = 0\).
Write the equation of the axis of symmetry as $x = $ (the x-coordinate of the vertex), then determine the domain (all real numbers) and the range based on the vertex and the direction the parabola opens.

Risposta video verificata per un problema simile:

Questa soluzione video è stata consigliata dai nostri tutor come utile per risolvere questo problema.
Durata del video:
2m

Concetti chiave

Ecco i concetti essenziali che devi comprendere per rispondere correttamente alla domanda.

Quadratic Functions and Their Graphs

A quadratic function is a polynomial of degree two, typically written as f(x) = ax^2 + bx + c. Its graph is a parabola that opens upward if a > 0 and downward if a < 0. Understanding the shape and key features of the parabola helps in sketching the graph accurately.
Video consigliato:
5:26
Graphs of Logarithmic Functions

Vertex and Axis of Symmetry

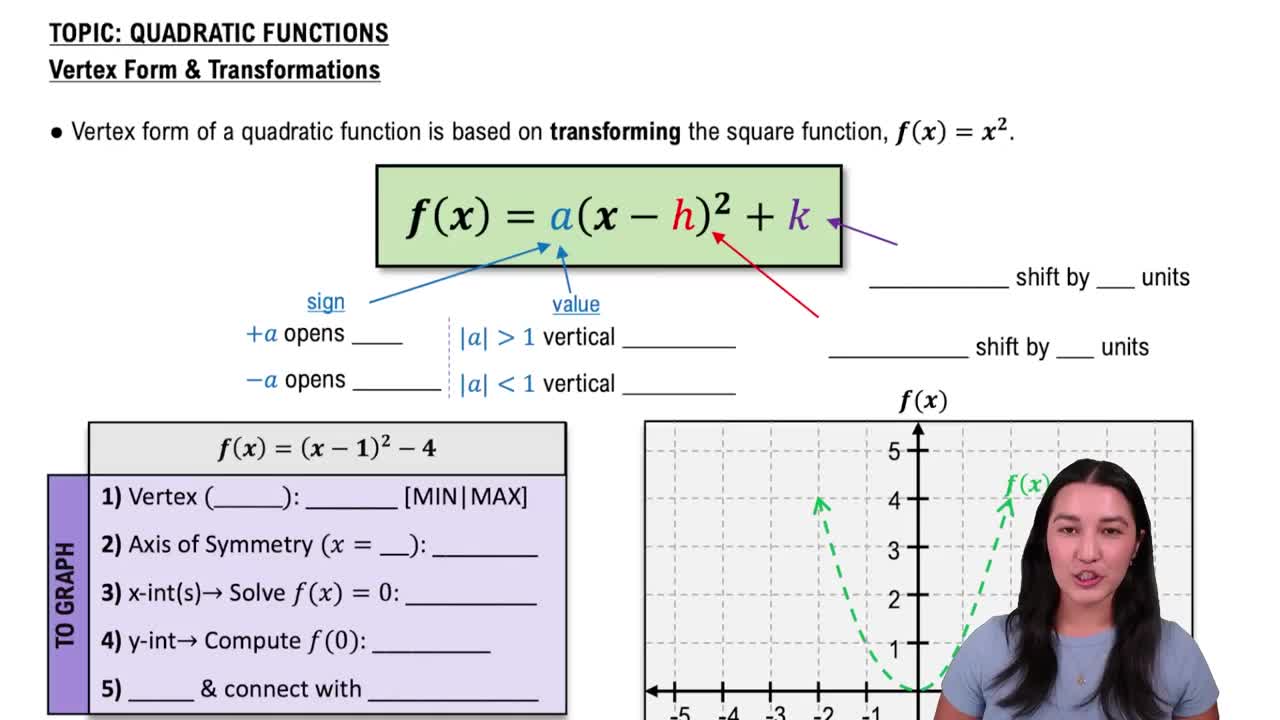
The vertex is the highest or lowest point on the parabola, found using the formula x = -b/(2a). The axis of symmetry is a vertical line through the vertex that divides the parabola into two mirror images. Knowing the vertex and axis helps in plotting the graph and understanding its symmetry.
Video consigliato:
08:07
Vertex Form

Domain and Range of Quadratic Functions

The domain of any quadratic function is all real numbers since x can take any value. The range depends on the vertex: if the parabola opens upward, the range is all y-values greater than or equal to the vertex's y-coordinate; if downward, all y-values less than or equal to the vertex's y-coordinate. This helps describe the function's output values.
Video consigliato:
4:22
Domain & Range of Transformed Functions