In Exercises 81–88, a. Find the slant asymptote of the graph of each rational function and b. Follow the seven-step strategy and use the slant asymptote to graph each rational function. f(x)=(x2+x−6)/(x−3)
Ch. 3 - Polynomial and Rational Functions

Capitolo 4, Problema 87
Solve each inequality in Exercises 86–91 using a graphing utility. 2x2 + 5x - 3 ≤ 0
Guida verificata passo dopo passo1
Identify the inequality to solve: \(2x^{2} + 5x - 3 \leq 0\).
Rewrite the inequality as an equation to find critical points: \(2x^{2} + 5x - 3 = 0\).
Use the quadratic formula to solve for \(x\): \(x = \frac{-b \pm \sqrt{b^{2} - 4ac}}{2a}\), where \(a=2\), \(b=5\), and \(c=-3\).
Calculate the roots from the quadratic formula; these roots divide the number line into intervals to test for the inequality.
Use a graphing utility to plot \(y = 2x^{2} + 5x - 3\) and determine where the graph lies on or below the \(x\)-axis (i.e., where \(y \leq 0\)) to find the solution intervals.

Risposta video verificata per un problema simile:
Questa soluzione video è stata consigliata dai nostri tutor come utile per risolvere questo problema.
Durata del video:
1mConcetti chiave
Ecco i concetti essenziali che devi comprendere per rispondere correttamente alla domanda.
Quadratic Inequalities
A quadratic inequality involves a quadratic expression set less than, greater than, or equal to zero. Solving it requires finding the range of x-values where the quadratic expression satisfies the inequality, often by analyzing the parabola's position relative to the x-axis.
Video consigliato:
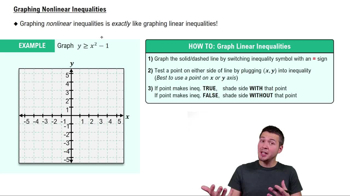
Nonlinear Inequalities
Graphing Quadratic Functions
Graphing a quadratic function y = ax² + bx + c produces a parabola. The graph helps visualize where the function is above or below the x-axis, which corresponds to positive or negative values of the quadratic expression, aiding in solving inequalities.
Video consigliato:
Graphs of Logarithmic Functions
Using Graphing Utilities
Graphing utilities, such as graphing calculators or software, allow quick plotting of functions to identify roots and intervals where inequalities hold. They provide a visual method to solve quadratic inequalities by showing where the graph lies relative to the x-axis.
Video consigliato:
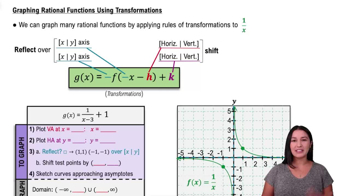
Graphing Rational Functions Using Transformations
Pratica correlata
Domanda del libro di testo
629
views
Domanda del libro di testo
Exercises 82–84 will help you prepare for the material covered in the next section. Let f(x)=an(x4−3x2−4). If f(3)=−150, determine the value of a_n.
370
views
Domanda del libro di testo
Solve each inequality in Exercises 86–91 using a graphing utility. (x - 4)/(x - 1) ≤ 0
495
views
Domanda del libro di testo
In Exercises 81–88, a. Find the slant asymptote of the graph of each rational function and b. Follow the seven-step strategy and use the slant asymptote to graph each rational function. f(x)=(x3+1)/(x2+2x)
601
views
Domanda del libro di testo
Solve each inequality in Exercises 86–91 using a graphing utility. x2 + 3x - 10 > 0
573
views
Domanda del libro di testo
Solve each inequality in Exercises 86–91 using a graphing utility. x3 + x2 - 4x - 4 > 0
548
views