Ch. 3 - Polynomial and Rational Functions
Blitzer - College Algebra 8th Edition
Blitzer8th EditionCollege AlgebraISBN: 9780136970514Non è quello che usi tu?Cambia libro di testo
Capitolo 4, Problema 9

Use the graph of the rational function in the figure shown to complete each statement in Exercises 9–14.
Graph of a rational function with vertical asymptotes at x = -3 and x = 1, and a horizontal asymptote at y = 0.


As x→−3−x\(\to\)-3^{-}, f(x)→f\(\left\)(x\(\right\))\(\to\)____

Guida verificata passo dopo passo
1
Identify the point of interest on the x-axis, which is \(x \to -3^-\), meaning we are approaching \(-3\) from the left side.
Look at the graph near \(x = -3\) on the left side to observe the behavior of the function \(f(x)\) as \(x\) approaches \(-3\) from values less than \(-3\).
Notice the value of \(f(x)\) as \(x\) gets closer to \(-3\) from the left. Check if the function values increase without bound (go to \(+\infty\)), decrease without bound (go to \(-\infty\)), or approach a finite number.
From the graph, observe that as \(x\) approaches \(-3\) from the left, the function \(f(x)\) decreases without bound, meaning \(f(x) \to -\infty\).
Summarize the behavior: As \(x \to -3^-\), \(f(x) \to -\infty\).

Risposta video verificata per un problema simile:

Questa soluzione video è stata consigliata dai nostri tutor come utile per risolvere questo problema.
Durata del video:
1m

Concetti chiave

Ecco i concetti essenziali che devi comprendere per rispondere correttamente alla domanda.

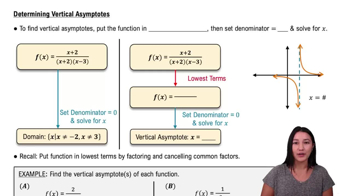
Vertical Asymptotes

Vertical asymptotes occur where the function approaches infinity or negative infinity as the input approaches a specific value. They indicate values of x where the function is undefined, often due to division by zero in rational functions. In the graph, vertical asymptotes are shown at x = 6 and x = 14.
Video consigliato:
3:12
Determining Vertical Asymptotes

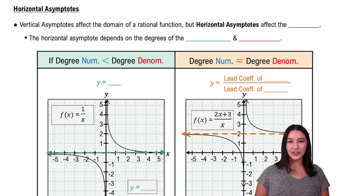
Horizontal Asymptotes

A horizontal asymptote represents the value that the function approaches as x tends to positive or negative infinity. It shows the end behavior of the function. In this graph, the horizontal asymptote is y = 0, meaning the function values get closer to zero as x becomes very large or very small.
Video consigliato:
4:48
Determining Horizontal Asymptotes

Limit Behavior Near a Point

The limit of a function as x approaches a specific value from the left or right describes the function's behavior near that point. For example, as x approaches -3 from the left (x → -3⁻), the function value approaches a certain number or infinity. Understanding this helps in interpreting the graph and completing limit statements.
Video consigliato:
05:01
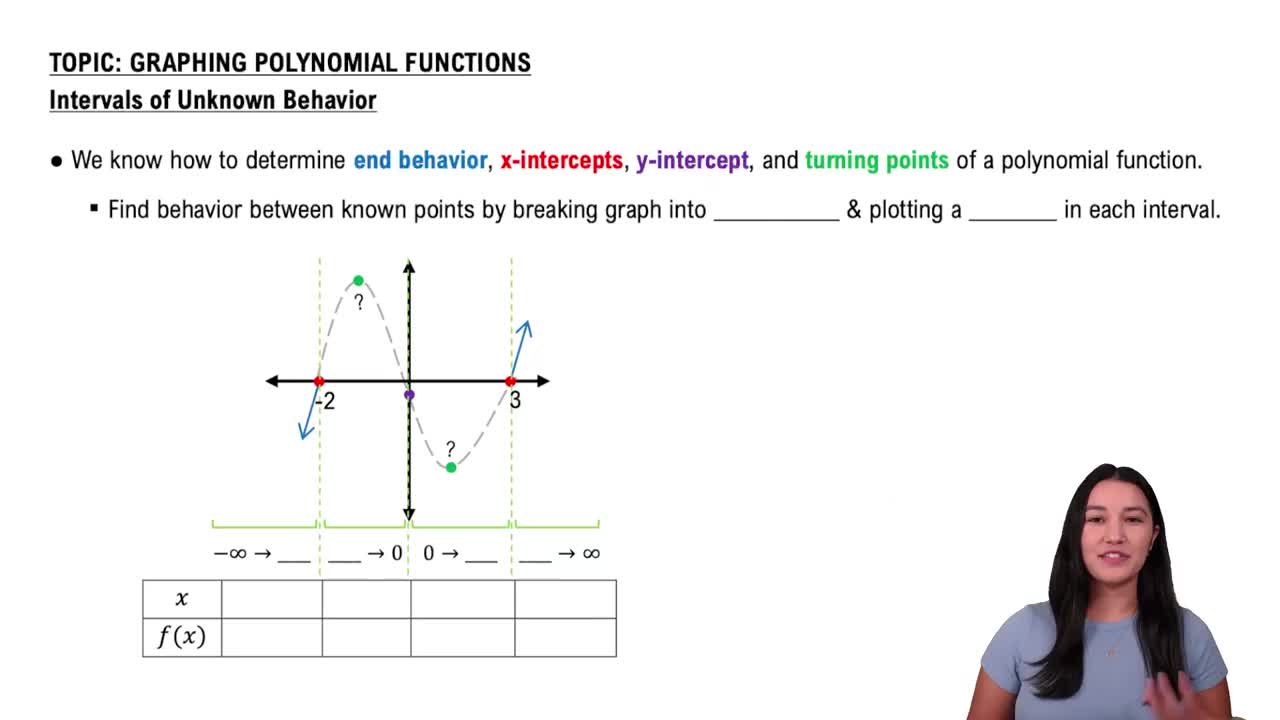
Identifying Intervals of Unknown Behavior