Ch. 5 - Systems of Equations and Inequalities
Blitzer - College Algebra 8th Edition
Blitzer8th EditionCollege AlgebraISBN: 9780136970514Non è quello che usi tu?Cambia libro di testo
Capitolo 6, Problema 40

In Exercises 39–45, graph each inequality. y ≤ (-1/2)x + 2

Guida verificata passo dopo passo
1
Step 1: Begin by identifying the inequality given: y ≤ (-1/2)x + 2. This represents a linear inequality where the boundary line is y = (-1/2)x + 2.
Step 2: Graph the boundary line y = (-1/2)x + 2. To do this, find the y-intercept (where x = 0). Substitute x = 0 into the equation to get y = 2. Plot the point (0, 2) on the graph.
Step 3: Determine the slope of the line, which is -1/2. This means for every 1 unit increase in x, y decreases by 1/2. Use this slope to plot another point starting from the y-intercept. For example, move 1 unit to the right (x = 1) and 1/2 unit down (y = 1.5). Plot this point.
Step 4: Draw the boundary line through the points. Since the inequality is ≤, the boundary line should be solid, indicating that points on the line are included in the solution.
Step 5: Shade the region below the line because the inequality is y ≤ (-1/2)x + 2. This represents all points where y is less than or equal to (-1/2)x + 2. The shaded region is the solution to the inequality.

Risposta video verificata per un problema simile:

Questa soluzione video è stata consigliata dai nostri tutor come utile per risolvere questo problema.
Durata del video:
4m

Concetti chiave

Ecco i concetti essenziali che devi comprendere per rispondere correttamente alla domanda.

Linear Inequalities

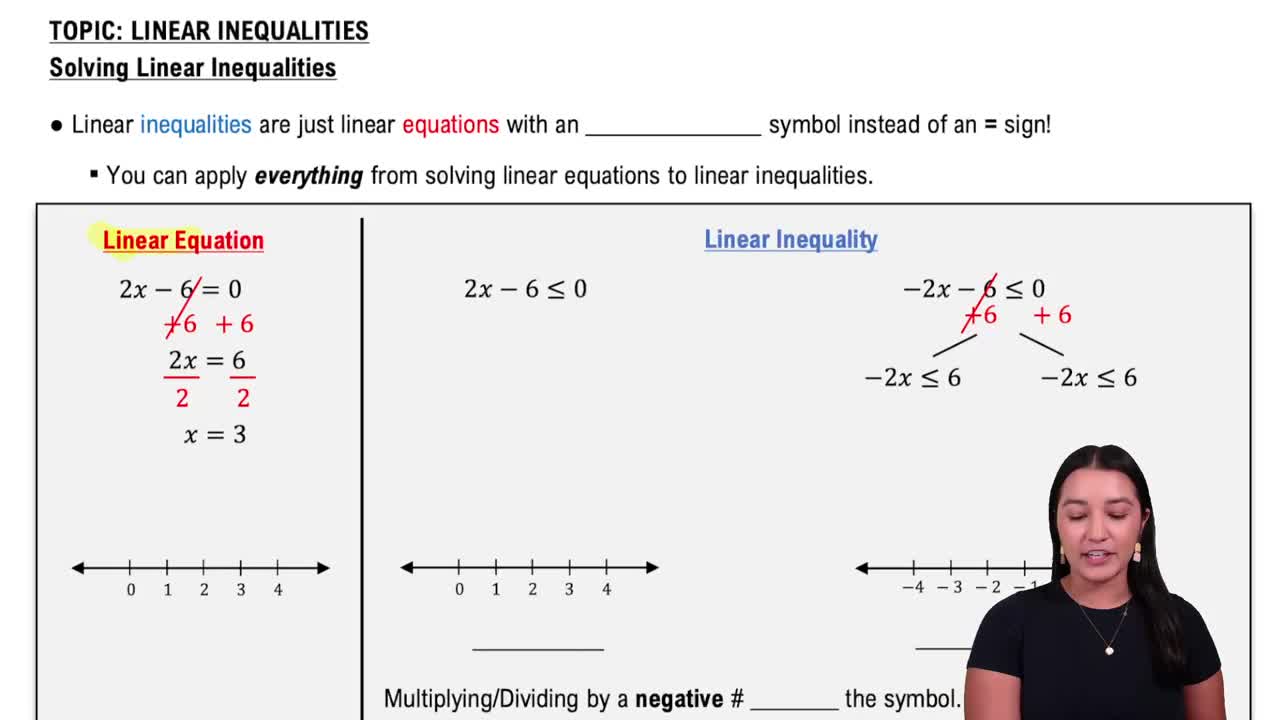
Linear inequalities are mathematical expressions that involve a linear function and an inequality sign (such as ≤, ≥, <, or >). They represent a range of values rather than a single solution, indicating that the dependent variable (y) is less than or equal to a linear expression in terms of the independent variable (x). Understanding how to interpret and graph these inequalities is crucial for visualizing the solution set.
Video consigliato:
06:07
Linear Inequalities

Graphing Linear Equations

Graphing linear equations involves plotting points on a coordinate plane that satisfy the equation. For the inequality y ≤ (-1/2)x + 2, first, the corresponding linear equation y = (-1/2)x + 2 is graphed as a straight line. The slope of -1/2 indicates a downward trend, and the y-intercept of 2 shows where the line crosses the y-axis. This foundational skill is essential for understanding how to represent inequalities graphically.
Video consigliato:
06:00
Categorizing Linear Equations

Shading the Solution Region

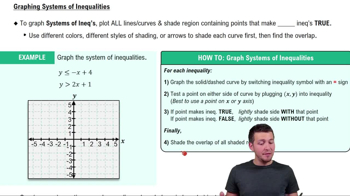
When graphing a linear inequality, the solution region is indicated by shading the area of the graph that satisfies the inequality. For y ≤ (-1/2)x + 2, the area below the line (including the line itself, since it is ≤) represents all the points (x, y) that fulfill the inequality. This visual representation helps in identifying all possible solutions and is a key aspect of understanding inequalities in a graphical context.
Video consigliato:
6:19
Systems of Inequalities