Ch. 5 - Systems of Equations and Inequalities
Blitzer - College Algebra 8th Edition
Blitzer8th EditionCollege AlgebraISBN: 9780136970514Non è quello che usi tu?Cambia libro di testo
Capitolo 6, Problema 59

In Exercises 57–59, graph the region determined by the constraints. Then find the maximum value of the given objective function, subject to the constraints. This is a piecewise function. Refer to the textbook.

Guida verificata passo dopo passo
1
Identify the constraints provided in the problem. Constraints are inequalities that define the feasible region. For example, they might look like \(x + y \leq 10\), \(x \geq 0\), and \(y \geq 0\). Write down all the constraints clearly.
Graph the constraints on a coordinate plane. For each inequality, first graph the corresponding equation as if it were an equality (e.g., \(x + y = 10\)). Then shade the region that satisfies the inequality. The feasible region is the intersection of all shaded regions.
Determine the vertices of the feasible region. These are the points where the boundary lines of the constraints intersect. Solve the system of equations formed by pairs of boundary lines to find these points.
Substitute the coordinates of each vertex into the given objective function. The objective function is typically a linear equation like \(z = 3x + 2y\). Evaluate the function at each vertex to determine the corresponding values.
Identify the maximum value of the objective function from the values calculated in the previous step. The vertex that gives the highest value is the solution to the optimization problem.

Risposta video verificata per un problema simile:

Questa soluzione video è stata consigliata dai nostri tutor come utile per risolvere questo problema.
Durata del video:
15m

Concetti chiave

Ecco i concetti essenziali che devi comprendere per rispondere correttamente alla domanda.

Graphing Constraints

Graphing constraints involves plotting inequalities on a coordinate plane to visualize the feasible region where all constraints are satisfied. Each inequality represents a boundary, and the area where these boundaries overlap indicates the possible solutions. Understanding how to graph these constraints is crucial for identifying the region of interest for optimization problems.
Video consigliato:
02:16
Graphs and Coordinates - Example

Objective Function

An objective function is a mathematical expression that defines the goal of an optimization problem, typically to maximize or minimize a certain quantity. In this context, it is evaluated at various points within the feasible region to determine the best possible outcome. Recognizing how to manipulate and evaluate the objective function is essential for finding optimal solutions.
Video consigliato:
6:37
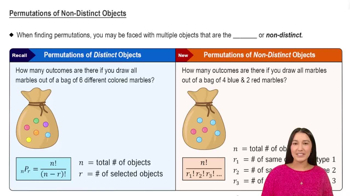
Permutations of Non-Distinct Objects

Piecewise Functions

A piecewise function is defined by different expressions based on the input value, which can lead to varying outputs depending on the specified conditions. In optimization problems, understanding how to work with piecewise functions is important, as the function's behavior may change across different segments of the domain, affecting the overall solution and maximum value sought.
Video consigliato:
4:56
Function Composition