Ch. 5 - Systems of Equations and Inequalities
Blitzer - College Algebra 8th Edition
Blitzer8th EditionCollege AlgebraISBN: 9780136970514Non è quello che usi tu?Cambia libro di testo
Capitolo 6, Problema 63

In Exercises 63–64, write each sentence as an inequality in two variables. Then graph the inequality. The y-variable is at least 4 more than the product of -2 and the x-variable.

Guida verificata passo dopo passo
1
Identify the variables: let x be the x-variable and y be the y-variable.
Translate the phrase 'the y-variable is at least 4 more than the product of -2 and the x-variable' into an inequality. 'At least' means 'greater than or equal to', and 'the product of -2 and the x-variable' is -2x. So the inequality is y \(\geq\) -2x + 4.
Rewrite the inequality in slope-intercept form if needed: y \(\geq\) -2x + 4 is already in slope-intercept form, where the slope is -2 and the y-intercept is 4.
To graph the inequality, first graph the boundary line y = -2x + 4. Since the inequality is 'greater than or equal to', the boundary line should be solid.
Determine which side of the line to shade by testing a point not on the line, such as (0,0). Substitute into the inequality: 0 \(\geq\) -2(0) + 4 becomes 0 \(\geq\) 4, which is false. So shade the side of the line that does not include (0,0).

Risposta video verificata per un problema simile:

Questa soluzione video è stata consigliata dai nostri tutor come utile per risolvere questo problema.
Durata del video:
3m

Concetti chiave

Ecco i concetti essenziali che devi comprendere per rispondere correttamente alla domanda.

Translating Verbal Statements into Inequalities

This involves converting a sentence describing a relationship between variables into a mathematical inequality. Key words like 'at least' indicate 'greater than or equal to' (≥), and understanding how to express phrases such as 'the product of -2 and the x-variable' is essential for accurate translation.
Video consigliato:
06:07
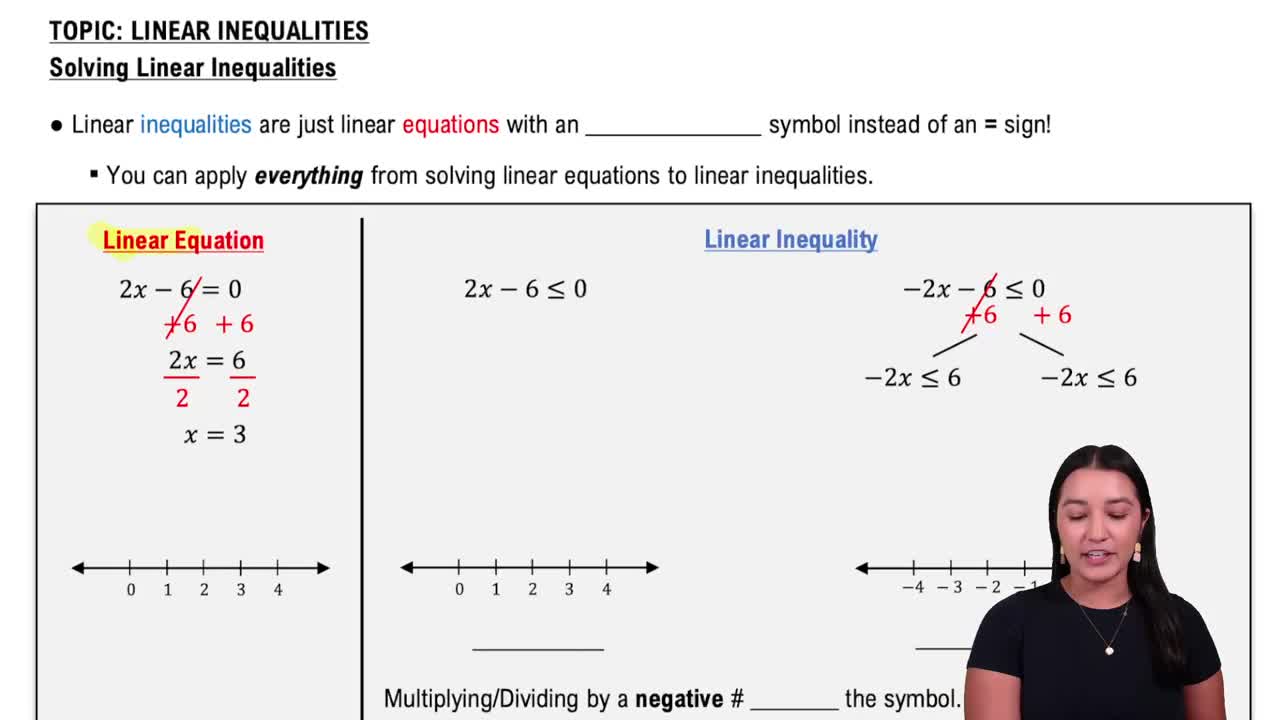
Linear Inequalities

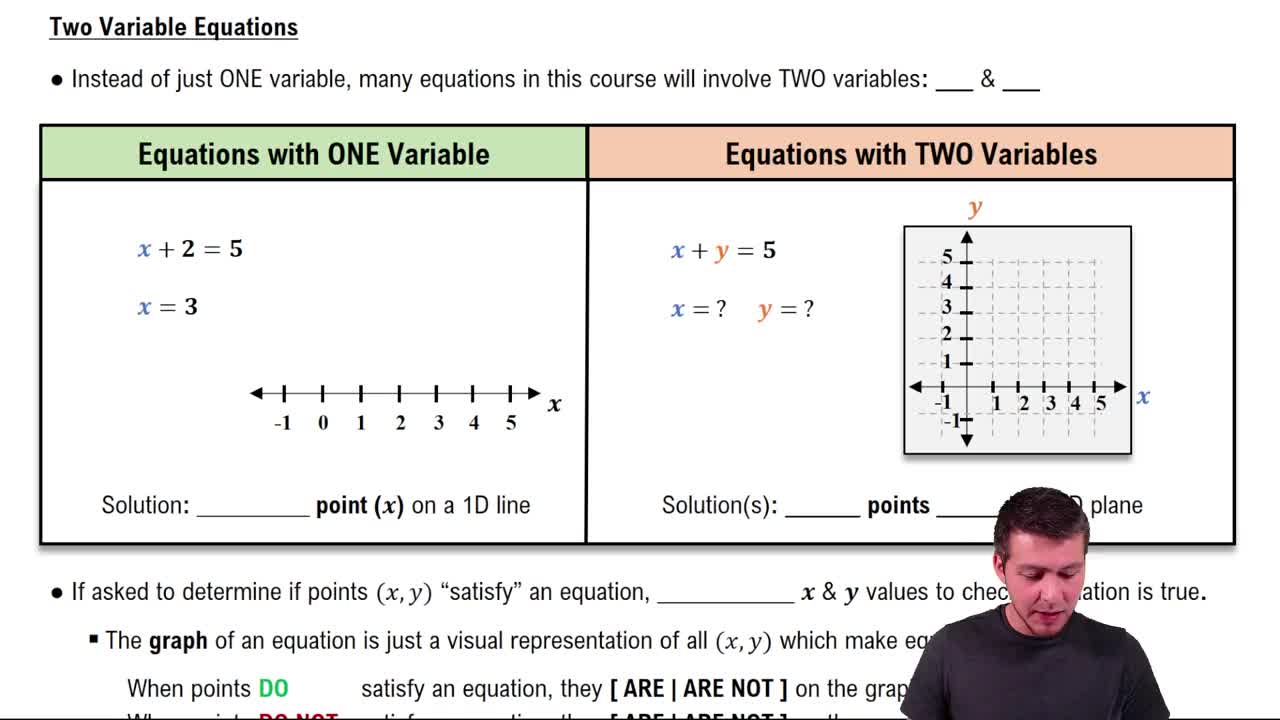
Inequalities in Two Variables

An inequality in two variables, such as y ≥ expression involving x, represents a region on the coordinate plane. It defines all points (x, y) that satisfy the inequality, not just a line, and understanding this helps in graphing the solution set correctly.
Video consigliato:
05:28
Equations with Two Variables

Graphing Linear Inequalities

Graphing involves first drawing the boundary line from the related equation (using equality), then shading the region that satisfies the inequality. Knowing how to determine which side to shade based on the inequality symbol is crucial for visualizing the solution.
Video consigliato:
06:07
Linear Inequalities