Based on the following reaction profile, how many intermediates are formed in the reaction A¡C? How many transition states are there? Which step, A¡B or B¡C, is the faster? For the reaction A¡C, is ΔE positive, negative, or zero? [Section 14.6]
Ch.14 - Chemical Kinetics
Brown14th EditionChemistry: The Central ScienceISBN: 9780134414232Non è quello che usi tu?Cambia libro di testo
Capitolo 14, Problema 11b
The following graph shows two different reaction pathways for the same overall reaction at the same temperature. Is each of the following statements true or false? (b) For both paths, the rate of the reverse reaction is slower than the rate of the forward reaction.

Guida verificata passo dopo passo1
Step 1: Identify the forward and reverse reactions on the graph. The forward reaction progresses from left to right, while the reverse reaction progresses from right to left.
Step 2: Observe the energy barriers (activation energies) for both the forward and reverse reactions. The activation energy is the peak of the curve minus the energy of the reactants for the forward reaction, and the peak of the curve minus the energy of the products for the reverse reaction.
Step 3: Compare the activation energies for the forward and reverse reactions for both pathways. The pathway with the lower activation energy will have a faster reaction rate.
Step 4: Determine if the activation energy for the reverse reaction is higher than that for the forward reaction in both pathways. If it is, then the rate of the reverse reaction is slower than the rate of the forward reaction.
Step 5: Conclude whether the statement 'For both paths, the rate of the reverse reaction is slower than the rate of the forward reaction' is true or false based on the comparison of activation energies.

Risposta video verificata per un problema simile:
Questa soluzione video è stata consigliata dai nostri tutor come utile per risolvere questo problema.
Durata del video:
1mConcetti chiave
Ecco i concetti essenziali che devi comprendere per rispondere correttamente alla domanda.
Reaction Pathways
Reaction pathways illustrate the energy changes that occur during a chemical reaction. They depict the energy of reactants, products, and the transition states, which are the highest energy points along the pathway. Understanding these pathways helps in analyzing how different conditions or catalysts can affect the rate and mechanism of a reaction.
Video consigliato:
Percorso guidato
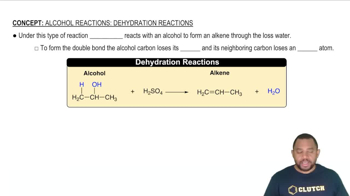
Alcohol Reactions: Dehydration Reactions
Forward and Reverse Reactions
In a chemical reaction, the forward reaction refers to the process where reactants are converted into products, while the reverse reaction is the conversion of products back into reactants. The rates of these reactions can differ based on the energy barriers depicted in the reaction pathway, influencing the overall dynamics of the reaction system.
Video consigliato:
Percorso guidato
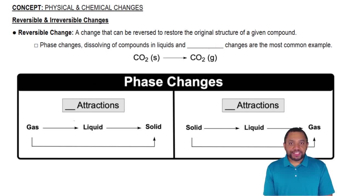
Reversible Changes in Matter
Activation Energy
Activation energy is the minimum energy required for a reaction to occur. It is represented by the height of the energy barrier between reactants and the transition state in a reaction pathway. A higher activation energy typically results in a slower reaction rate, which is crucial for determining whether the forward or reverse reaction is favored under specific conditions.
Video consigliato:
Percorso guidato
Activity Series Chart
Pratica correlata
Domanda del libro di testo
1039
views
3
rank
Domanda del libro di testo
The accompanying graph shows plots of ln k versus 1>T for two different reactions. The plots have been extrapolated to the y-intercepts. Which reaction (red or blue) has (b) the larger value for the frequency factor, A? [Section 14.5]
780
views
Domanda del libro di testo
Consider the diagram that follows, which represents two steps in an overall reaction. The red spheres are oxygen, the blue ones nitrogen, and the green ones fluorine. (d) Write the rate law for the overall reaction if the first step is the slow, rate-determining step. [Section 14.6]
462
views
Domanda del libro di testo
The accompanying graph shows plots of ln k versus 1>T for two different reactions. The plots have been extrapolated to the y-intercepts. Which reaction (red or blue) has (a) the larger value for Ea,
706
views
