
Ch.14 - Chemical Kinetics
Brown - Chemistry: The Central Science 14th Edition
Brown14th EditionChemistry: The Central ScienceISBN: 9780134414232Non è quello che usi tu?Cambia libro di testo
Capitolo 14, Problema 10b

The accompanying graph shows plots of ln k versus 1>T for two different reactions. The plots have been extrapolated to the y-intercepts. Which reaction (red or blue) has (b) the larger value for the frequency factor, A? [Section 14.5]
Graph showing ln k vs 1/T for two reactions, indicating their frequency factors.

Guida verificata passo dopo passo
1
Identify the Arrhenius equation in its linear form: \( \ln k = \ln A - \frac{E_a}{R} \cdot \frac{1}{T} \).
Recognize that the y-intercept of the plot of \( \ln k \) versus \( \frac{1}{T} \) corresponds to \( \ln A \).
Observe the graph and note the y-intercepts for both Reaction 1 (blue) and Reaction 2 (red).
Determine which reaction has the higher y-intercept value, as this indicates a larger \( \ln A \) value.
Conclude that the reaction with the higher y-intercept has the larger frequency factor, \( A \).

Risposta video verificata per un problema simile:

Questa soluzione video è stata consigliata dai nostri tutor come utile per risolvere questo problema.
Durata del video:
1m

Concetti chiave

Ecco i concetti essenziali che devi comprendere per rispondere correttamente alla domanda.

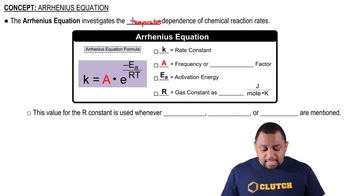
Arrhenius Equation

The Arrhenius equation relates the rate constant (k) of a reaction to temperature (T) and the frequency factor (A). It is expressed as k = A * e^(-Ea/RT), where Ea is the activation energy and R is the gas constant. The frequency factor A represents the number of collisions that result in a reaction, and it is influenced by factors such as molecular orientation and collision frequency.
Video consigliato:
Percorso guidato
01:20
Arrhenius Equation

Graphical Interpretation of ln k vs. 1/T

In a plot of ln k versus 1/T, the slope of the line is equal to -Ea/R, where Ea is the activation energy. The y-intercept of this plot corresponds to ln A, allowing for the determination of the frequency factor A. A higher y-intercept indicates a larger frequency factor, suggesting that the reaction has a greater likelihood of occurring due to more effective collisions.
Video consigliato:
Percorso guidato
02:33
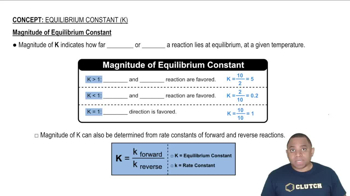
Magnitude of Equilibrium Constant

Extrapolation of Graphs

Extrapolation involves extending the plotted lines of the graph to find values outside the measured data range. In this context, extrapolating the lines to the y-intercept allows for the determination of the frequency factors for both reactions. By comparing the y-intercepts of the two reactions, one can ascertain which reaction has the larger frequency factor, A.
Video consigliato:
Percorso guidato
02:01
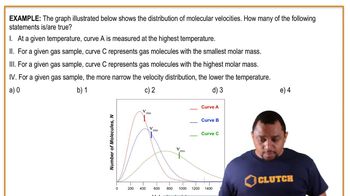
Velocity Distributions Example