Ch.13 - Solutions & Their Properties
McMurry - Chemistry 8th Edition
McMurry8th EditionChemistryISBN: 9781292336145Non è quello che usi tu?Cambia libro di testo
Capitolo 13, Problema 80

Look at the solubility graph in Figure 13.7, and estimate which member of each of the following pairs has the higher molar solubility at the given temperature. (b) CH3CO2Na or glucose at 20 °CSolubility graph showing solubility of various salts in water at different temperatures.

Guida verificata passo dopo passo
1
Identify the solubility values for CH3CO2Na and glucose at 20 °C from the solubility graph.
Note that the solubility graph provided does not include data for CH3CO2Na or glucose directly.
Understand that CH3CO2Na (sodium acetate) is an ionic compound and generally has higher solubility in water compared to glucose, which is a molecular compound.
Research or recall typical solubility values for CH3CO2Na and glucose at 20 °C. Sodium acetate typically has a solubility of around 119 g/100 mL, while glucose has a solubility of around 91 g/100 mL at 20 °C.
Compare the solubility values: CH3CO2Na has a higher molar solubility than glucose at 20 °C.

Risposta video verificata per un problema simile:

Questa soluzione video è stata consigliata dai nostri tutor come utile per risolvere questo problema.
Durata del video:
5m

Concetti chiave

Ecco i concetti essenziali che devi comprendere per rispondere correttamente alla domanda.

Molar Solubility

Molar solubility refers to the maximum amount of solute that can dissolve in a given volume of solvent at a specific temperature, expressed in moles per liter. It is a crucial concept in understanding how different substances behave in solution and is influenced by factors such as temperature and the nature of the solute and solvent.
Video consigliato:
Percorso guidato
04:13
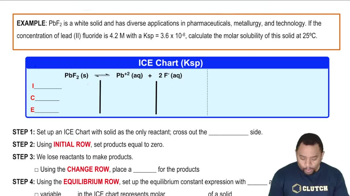
Molar Solubility Example

Solubility Graphs

Solubility graphs visually represent the solubility of various substances in a solvent, typically water, as a function of temperature. Each curve on the graph indicates how the solubility of a specific solute changes with temperature, allowing for easy comparison between different solutes at a given temperature.
Video consigliato:
Percorso guidato
00:28
Solubility Rules

Comparative Analysis

Comparative analysis involves evaluating two or more substances to determine which has a higher or lower property—in this case, molar solubility. By examining the solubility graph, one can estimate the solubility of CH3CO2Na and glucose at 20 °C, facilitating a clear understanding of their relative solubility in water.
Video consigliato:
Percorso guidato
06:11
Dimensional Analysis