Ch.15 - Chemical Kinetics
Tro - Chemistry: A Molecular Approach 6th Edition
Tro6th EditionChemistry: A Molecular ApproachISBN: 9780137832217Non è quello che usi tu?Cambia libro di testo
Capitolo 15, Problema 35b

Consider the reaction: H2( g) + Br2( g) → 2 HBr( g) The graph shows the concentration of Br2 as a function of time.
b. Make a rough sketch of a curve representing the concentration of HBr as a function of time. Assume that the initial concentration of HBr is zero

Guida verificata passo dopo passo
1
Start by understanding that the reaction is a synthesis reaction where hydrogen gas (H_2) and bromine gas (Br_2) react to form hydrogen bromide (HBr).
Since the initial concentration of HBr is zero, the concentration of HBr will increase as the reaction proceeds.
The stoichiometry of the reaction shows that for every mole of Br_2 that reacts, 2 moles of HBr are produced.
As the concentration of Br_2 decreases over time, the concentration of HBr will increase proportionally, but at twice the rate due to the 1:2 stoichiometric ratio.
Sketch a curve that starts at zero and increases over time, showing a steeper slope compared to the decrease in Br_2, reflecting the production of HBr.

Risposta video verificata per un problema simile:

Questa soluzione video è stata consigliata dai nostri tutor come utile per risolvere questo problema.
Durata del video:
4m

Concetti chiave

Ecco i concetti essenziali che devi comprendere per rispondere correttamente alla domanda.

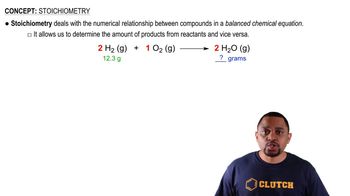
Chemical Reaction Stoichiometry

Chemical reaction stoichiometry refers to the quantitative relationships between reactants and products in a chemical reaction. In the given reaction, one mole of H<sub>2</sub> reacts with one mole of Br<sub>2</sub> to produce two moles of HBr. Understanding stoichiometry is essential for predicting how the concentrations of reactants and products change over time.
Video consigliato:
Percorso guidato
01:16
Stoichiometry Concept

Concentration vs. Time Graphs

Concentration vs. time graphs visually represent how the concentration of reactants and products changes during a chemical reaction. For the reaction provided, as Br<sub>2</sub> is consumed, its concentration decreases, while the concentration of HBr increases. Sketching these curves requires understanding the initial conditions and the rates of reaction.
Video consigliato:
Percorso guidato
03:12
Precipitation: Ksp vs Q Example

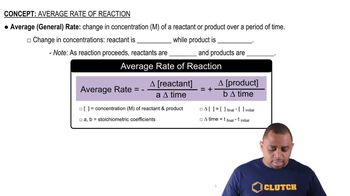
Rate of Reaction

The rate of reaction describes how quickly reactants are converted into products over time. It is influenced by factors such as concentration, temperature, and the presence of catalysts. In this reaction, the rate can be inferred from the change in concentration of Br<sub>2</sub> and the corresponding increase in HBr, which is crucial for accurately sketching the concentration curve.
Video consigliato:
Percorso guidato
02:03
Average Rate of Reaction