Ch. 19 - Genetic Analysis of Quantitative Traits
Sanders - Genetic Analysis: An Integrated Approach 3rd Edition
Sanders3rd EditionGenetic Analysis: An Integrated ApproachISBN: 9780135564172Non è quello che usi tu?Cambia libro di testo
Capitolo 19, Problema 20

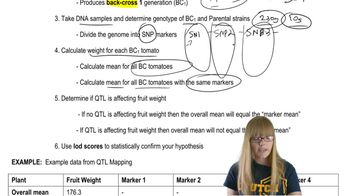
An association of racehorse owners is seeking a new genetic strategy to improve the running speed of their horses. Traditional breeding of fast male and female horses has proven expensive and time-consuming, and the breeders are interested in an approach using quantitative trait loci as a basis for selecting breeding pairs of horses. Write a brief synopsis (∼50 words) of QTL mapping to explain how genes influencing running speed might be identified in horses.

Guida verificata passo dopo passo
1
Quantitative Trait Loci (QTL) mapping is a method used to identify regions of the genome associated with specific traits, such as running speed in horses.
Step 1: Begin by selecting a population of horses with varying running speeds and genetic diversity.
Step 2: Measure the running speed of each horse and collect DNA samples for genotyping.
Step 3: Use molecular markers (e.g., SNPs or microsatellites) to map genetic variations across the genome.
Step 4: Perform statistical analysis to correlate genetic markers with variations in running speed, identifying loci that influence the trait.
Step 5: Validate the identified QTLs by further testing or breeding experiments to confirm their impact on running speed.

Risposta video verificata per un problema simile:

Questa soluzione video è stata consigliata dai nostri tutor come utile per risolvere questo problema.
Durata del video:
2m

Concetti chiave

Ecco i concetti essenziali che devi comprendere per rispondere correttamente alla domanda.

Quantitative Trait Loci (QTL)

Quantitative Trait Loci (QTL) are specific regions of the genome that are associated with a particular quantitative trait, such as running speed in horses. By identifying these loci, breeders can understand the genetic basis of traits and select breeding pairs that carry favorable alleles to enhance desired characteristics.
Video consigliato:

Genetic Mapping

Genetic mapping involves determining the location of genes on chromosomes and their relationship to traits. In QTL mapping, researchers use statistical methods to correlate phenotypic data (like speed) with genotypic data (DNA markers), allowing them to pinpoint the genetic factors influencing the trait.
Video consigliato:
Percorso guidato
11:11
Mapping Overview

Marker-Assisted Selection

Marker-Assisted Selection (MAS) is a breeding technique that uses genetic markers linked to desirable traits to select individuals for breeding. By employing QTL mapping, breeders can utilize MAS to efficiently choose horses that possess genetic markers associated with improved running speed, thereby accelerating the breeding process.
Video consigliato:
Percorso guidato
07:11
Mapping with Markers
Pratica correlata
Domanda del libro di testo

Applied to the study of the human genome, a goal of GWAS is to locate chromosome regions that are likely to contain genes influencing the risk of disease. Specific genes can be identified in these regions, and particular mutant alleles that increase disease risk can be sequenced. To date, the identification of alleles that increase disease risk has occasionally led to a new therapeutic strategy, but more often the identification of disease alleles is the only outcome.

What personal or ethical issues arising from GWAS might be of concern to physicians or to those who might carry an allele that increases disease risk?

374
views
Domanda del libro di testo

Applied to the study of the human genome, a goal of GWAS is to locate chromosome regions that are likely to contain genes influencing the risk of disease. Specific genes can be identified in these regions, and particular mutant alleles that increase disease risk can be sequenced. To date, the identification of alleles that increase disease risk has occasionally led to a new therapeutic strategy, but more often the identification of disease alleles is the only outcome.

From a physician's point of view, what is the value of being able to identify alleles that increase the risk of a particular disease?

375
views
Domanda del libro di testo

Applied to the study of the human genome, a goal of GWAS is to locate chromosome regions that are likely to contain genes influencing the risk of disease. Specific genes can be identified in these regions, and particular mutant alleles that increase disease risk can be sequenced. To date, the identification of alleles that increase disease risk has occasionally led to a new therapeutic strategy, but more often the identification of disease alleles is the only outcome.

What is the value of being able to identify alleles that increase disease risk for a person who is currently free of the disease but who is at risk of developing the disease due to its presence in the family?

419
views
Domanda del libro di testo

In studies of human MZ and DZ twin pairs of the same sex who are reared together, the following concordance values are identified for various traits. Based on the values shown, describe the relative importance of genes versus the influence of environmental factors for each trait.

484
views
Domanda del libro di testo

During a visit, your grandparents comment on how tall you are compared with them. You tell them that in your genetics class, you learned that height in humans has high heritability, although environmental factors also influence adult height. You correctly explain the meaning of heritability, and your grandfather asks, 'How can height be highly heritable and still be influenced by the environment?' What explanation do you give your grandfather?

411
views
Domanda del libro di testo

Two pure-breeding wheat strains, one producing dark red kernels and the other producing white kernels, are crossed to produce F₁ with pink kernel color. When an F₁ plant is self-fertilized and its seed collected and planted, the resulting F₂ consists of 160 plants with kernel colors as shown in the following table.

If an F₁ plant is crossed to a dark red plant, what are the expected progeny phenotypes, and what is the expected proportion of each phenotype?

437
views