Ch. 5 - Genetic Linkage and Mapping in Eukaryotes
Sanders - Genetic Analysis: An Integrated Approach 3rd Edition
Sanders3rd EditionGenetic Analysis: An Integrated ApproachISBN: 9780135564172Non è quello che usi tu?Cambia libro di testo
Capitolo 5, Problema 29a

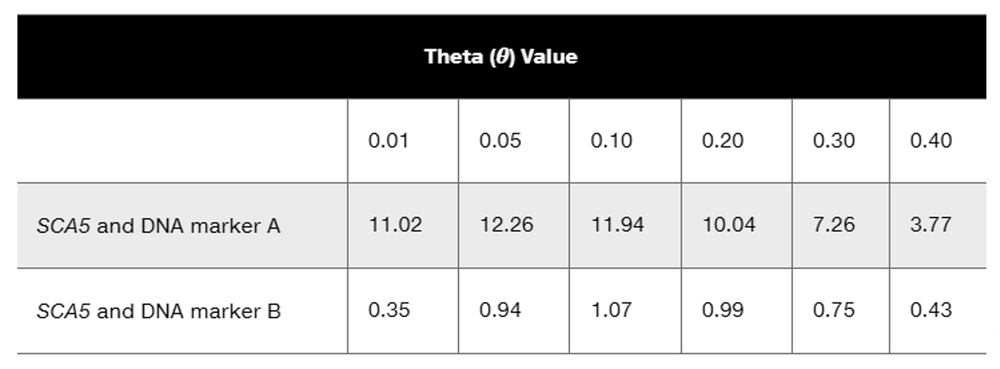
A 2006 genetic study of a large American family (Ikeda et al., 2006) identified genetic linkage between DNA markers on chromosome 11 and the gene producing the autosomal dominant neuromuscular disorder spinocerebellar ataxia type 5 (SCA5). The following lod score data are taken from the 2006 study:                  
Lod score data table showing theta values for genetic linkage between SCA5 and DNA markers A and B.
Does either group of lod scores indicate statistically significant odds in favor of genetic linkage? Explain your answer.

Guida verificata passo dopo passo
1
Step 1: Understand the concept of a LOD (logarithm of odds) score. A LOD score is used in genetic linkage analysis to determine whether two loci (e.g., a gene and a DNA marker) are likely to be located near each other on a chromosome. A LOD score of 3 or higher is generally considered evidence of significant genetic linkage, as it indicates odds of 1000:1 in favor of linkage.
Step 2: Analyze the LOD scores provided for SCA5 and DNA marker A. Look at the LOD scores across the different recombination fractions (θ values). Identify whether any of these scores meet or exceed the threshold of 3 for significant linkage.
Step 3: Similarly, analyze the LOD scores provided for SCA5 and DNA marker B. Again, examine the scores across the θ values and determine if any of them meet or exceed the threshold of 3 for significant linkage.
Step 4: Compare the LOD scores for both DNA marker A and DNA marker B. Determine which marker, if any, shows stronger evidence of genetic linkage with SCA5 based on the LOD score values.
Step 5: Conclude whether either group of LOD scores (for DNA marker A or DNA marker B) indicates statistically significant odds in favor of genetic linkage. Provide an explanation based on the threshold of 3 and the observed LOD scores.

Risposta video verificata per un problema simile:

Questa soluzione video è stata consigliata dai nostri tutor come utile per risolvere questo problema.
Durata del video:
2m

Concetti chiave

Ecco i concetti essenziali che devi comprendere per rispondere correttamente alla domanda.

Lod Score

A lod score (logarithm of the odds) is a statistical measure used in genetics to evaluate the likelihood of genetic linkage between a trait and a specific genetic marker. A lod score greater than 3 is typically considered evidence of significant linkage, while a score less than -2 suggests no linkage. This metric helps researchers determine whether observed inheritance patterns in families are due to genetic factors.
Video consigliato:
Percorso guidato
04:06
Formation of Plant Gametes

Theta (θ) Value

Theta (θ) represents the recombination fraction, which is the probability that two genetic markers will be separated during meiosis due to recombination. It ranges from 0 to 0.5, where 0 indicates complete linkage (no recombination) and 0.5 indicates independent assortment. Understanding θ is crucial for interpreting lod scores, as it directly influences the likelihood of observing certain inheritance patterns.
Video consigliato:

Autosomal Dominant Inheritance

Autosomal dominant inheritance is a pattern where only one copy of a mutated gene from an affected parent can cause the disorder in offspring. This means that the trait can be passed down through generations, with each child having a 50% chance of inheriting the condition. Recognizing this inheritance pattern is essential for understanding the genetic basis of disorders like spinocerebellar ataxia type 5 (SCA5) and assessing the risk in family members.
Video consigliato:
Percorso guidato
04:37
Variations on Dominance
Pratica correlata
Domanda del libro di testo

Neurofibromatosis 1 (NF1) is an autosomal dominant disorder inherited on human chromosome 17. Part of the analysis mapping the NF1 gene to chromosome 17 came from genetic linkage studies testing segregation of NF1 and DNA genetic markers on various chromosomes. A DNA marker with two alleles, designated 1 and 2, is linked to NF1. The pedigree below shows segregation of NF1 (darkened symbols) and gives genotypes for the DNA marker for each family member.

Based on the phase of alleles on chromosomes in generation II, is there any evidence of recombination among the eight offspring in generation III? Explain.

555
views
Domanda del libro di testo

Neurofibromatosis 1 (NF1) is an autosomal dominant disorder inherited on human chromosome 17. Part of the analysis mapping the NF1 gene to chromosome 17 came from genetic linkage studies testing segregation of NF1 and DNA genetic markers on various chromosomes. A DNA marker with two alleles, designated 1 and 2, is linked to NF1. The pedigree below shows segregation of NF1 (darkened symbols) and gives genotypes for the DNA marker for each family member.

Determine the alleles for the NF1 gene and the DNA marker gene on each chromosome carried by the four family members in generation I and generation II. Use N for the dominant NF1 allele and n for the recessive allele and assume I-1 is heterozygous for the disease allele (Nn).

926
views
Domanda del libro di testo

Neurofibromatosis 1 (NF1) is an autosomal dominant disorder inherited on human chromosome 17. Part of the analysis mapping the NF1 gene to chromosome 17 came from genetic linkage studies testing segregation of NF1 and DNA genetic markers on various chromosomes. A DNA marker with two alleles, designated 1 and 2, is linked to NF1. The pedigree below shows segregation of NF1 (darkened symbols) and gives genotypes for the DNA marker for each family member.

What is the estimated recombination frequency between the NF1 gene and the DNA marker?

833
views
Domanda del libro di testo

A 2006 genetic study of a large American family (Ikeda et al., 2006) identified genetic linkage between DNA markers on chromosome 11 and the gene producing the autosomal dominant neuromuscular disorder spinocerebellar ataxia type 5 (SCA5). The following lod score data are taken from the 2006 study:                  

Based on the available information, is DNA marker A linked to the gene producing SCA5? Explain your answer.

441
views
Domanda del libro di testo

A 2006 genetic study of a large American family (Ikeda et al., 2006) identified genetic linkage between DNA markers on chromosome 11 and the gene producing the autosomal dominant neuromuscular disorder spinocerebellar ataxia type 5 (SCA5). The following lod score data are taken from the 2006 study:

Based on available information, is DNA marker B linked to the gene for SCA5? Explain your answer.

592
views
Domanda del libro di testo

A 2006 genetic study of a large American family (Ikeda et al., 2006) identified genetic linkage between DNA markers on chromosome 11 and the gene producing the autosomal dominant neuromuscular disorder spinocerebellar ataxia type 5 (SCA5). The following lod score data are taken from the 2006 study:                  

What is the maximum value for each set of lod scores?

537
views