Ch.1 Chemistry in Our Lives
Timberlake - Chemistry: An Introduction to General, Organic, and Biological Chemistry 13th Edition
Timberlake13th EditionChemistry: An Introduction to General, Organic, and Biological ChemistryISBN: 9780134421353Non è quello che usi tu?Cambia libro di testo
Capitolo 1, Problema 24d

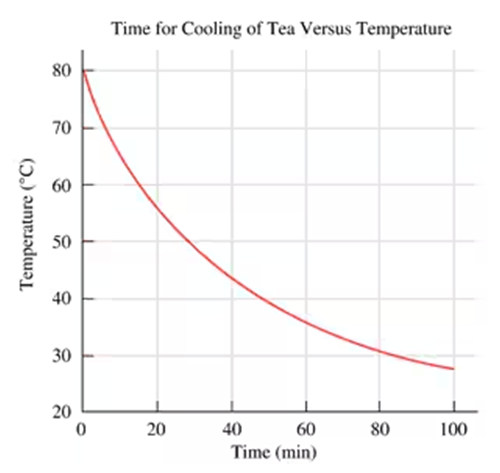
Use the following graph for problems 1.23 and 1.24:

How many minutes were needed to reach a temperature of 45 °C?

Guida verificata passo dopo passo
1
Step 1: Observe the graph titled 'Temperature of a Liquid vs Heating Time'. The x-axis represents time in minutes, and the y-axis represents temperature in degrees Celsius (°C).
Step 2: Locate the temperature of 45 °C on the y-axis. This is the target temperature we are trying to find the corresponding time for.
Step 3: Draw a horizontal line from the 45 °C mark on the y-axis until it intersects the curve representing the temperature change over time.
Step 4: From the point of intersection, draw a vertical line down to the x-axis to determine the corresponding time in minutes.
Step 5: Read the value on the x-axis where the vertical line meets it. This value represents the number of minutes needed to reach a temperature of 45 °C.

Risposta video verificata per un problema simile:

Questa soluzione video è stata consigliata dai nostri tutor come utile per risolvere questo problema.
Durata del video:
59s

Concetti chiave

Ecco i concetti essenziali che devi comprendere per rispondere correttamente alla domanda.

Graph Interpretation

Graph interpretation involves analyzing visual data representations to extract meaningful information. In this context, understanding how to read the axes, identify trends, and determine specific values, such as the time it takes to reach a certain temperature, is crucial for answering the question.
Video consigliato:
Percorso guidato
00:35
The Scientific Method Example 2

Temperature vs. Time Relationship

The relationship between temperature and time in this graph illustrates how a liquid's temperature increases as it is heated over time. Recognizing this relationship helps in predicting the time required to reach specific temperatures, such as 45 °C, by observing the curve's progression.
Video consigliato:
Percorso guidato
04:56
Logarithmic Relationships

Data Extraction

Data extraction refers to the process of obtaining specific values from a graph. In this case, it involves locating the point where the temperature reaches 45 °C on the graph and tracing it horizontally to find the corresponding time in minutes, which is essential for accurately answering the question.
Video consigliato: