Ch.7 Chemical Quantities and Reactions
Timberlake - Chemistry: An Introduction to General, Organic, and Biological Chemistry 13th Edition
Timberlake13th EditionChemistry: An Introduction to General, Organic, and Biological ChemistryISBN: 9780134421353Non è quello che usi tu?Cambia libro di testo
Capitolo 7, Problema 67c

Draw an energy diagram for an exothermic reaction.

Guida verificata passo dopo passo
1
Start by understanding that an energy diagram for a chemical reaction shows the energy changes during the reaction. For an exothermic reaction, the energy of the products is lower than the energy of the reactants because energy is released to the surroundings.
Draw a horizontal axis labeled 'Reaction Progress' to represent the progress of the reaction from reactants to products. The vertical axis should be labeled 'Energy' to represent the energy levels.
Mark a higher energy level on the vertical axis for the reactants and a lower energy level for the products. This difference in energy levels represents the energy released during the reaction.
Draw a curve that starts at the reactants' energy level, rises to a peak (representing the activation energy, which is the energy required to initiate the reaction), and then falls to the products' energy level. The peak of the curve is the transition state.
Label the diagram clearly: indicate the activation energy (the difference between the reactants' energy and the peak of the curve) and the energy released (the difference between the reactants' and products' energy levels). This will help visualize the exothermic nature of the reaction.

Risposta video verificata per un problema simile:

Questa soluzione video è stata consigliata dai nostri tutor come utile per risolvere questo problema.
Durata del video:
3m

Concetti chiave

Ecco i concetti essenziali che devi comprendere per rispondere correttamente alla domanda.

Exothermic Reaction

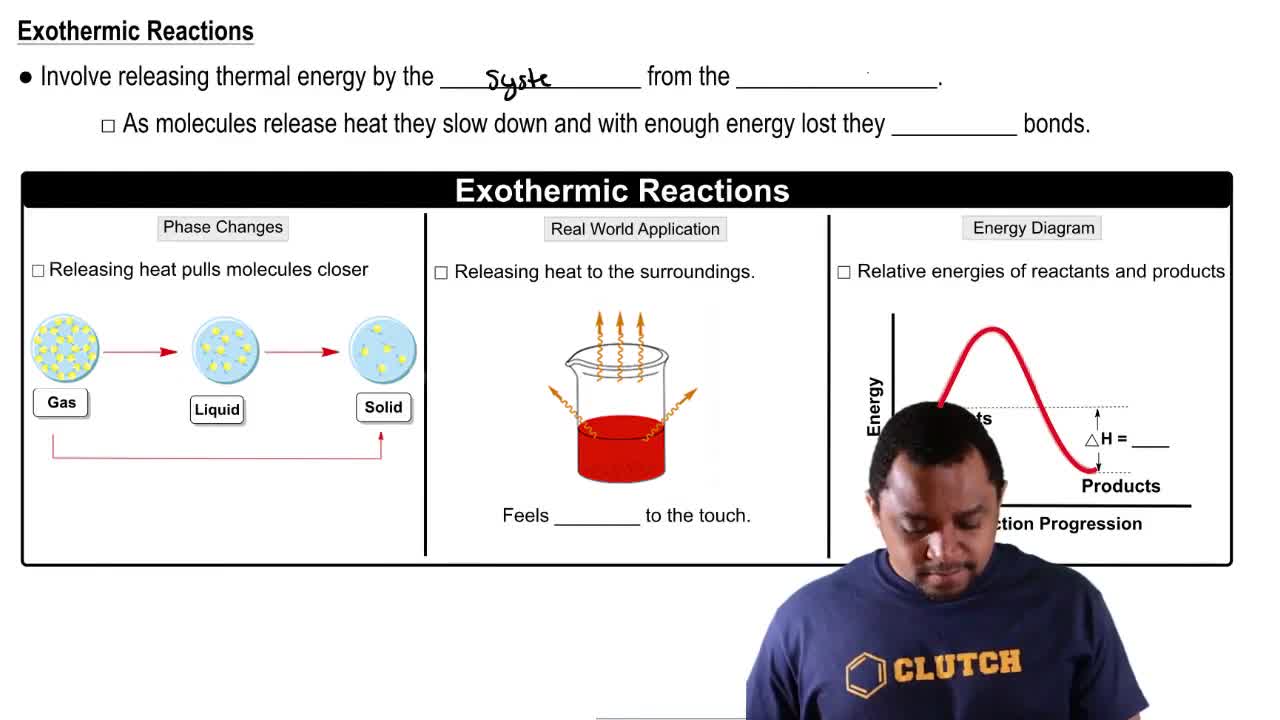
An exothermic reaction is a chemical process that releases energy, usually in the form of heat, to its surroundings. This occurs when the total energy of the products is lower than that of the reactants, resulting in a net release of energy. Common examples include combustion reactions, such as burning wood or fossil fuels.
Video consigliato:
Percorso guidato
02:38
Endothermic & Exothermic Reactions

Energy Diagram

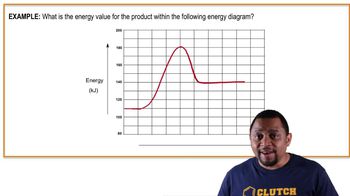
An energy diagram, also known as a reaction coordinate diagram, visually represents the energy changes during a chemical reaction. It typically plots the energy of the system on the vertical axis against the progress of the reaction on the horizontal axis. For exothermic reactions, the diagram shows a downward slope, indicating a decrease in energy as reactants transform into products.
Video consigliato:
Percorso guidato
00:37
Energy Diagrams Example 1

Activation Energy

Activation energy is the minimum energy required for a chemical reaction to occur. It represents the energy barrier that must be overcome for reactants to be converted into products. In an energy diagram, this is depicted as the peak of the curve, where the energy is at its highest before the reaction proceeds to form products, which are at a lower energy level in exothermic reactions.
Video consigliato:
Percorso guidato
1:06
Factors Affecting Enzyme Activity Concept 1