Ch. 9 - Controlling Microbial Growth in the Environment
Bauman - Microbiology with Diseases by Taxonomy 6th Edition
Bauman6th EditionMicrobiology with Diseases by TaxonomyISBN: 9780134832302Non è quello che usi tu?Cambia libro di testo
Capitolo 9, Problema 1

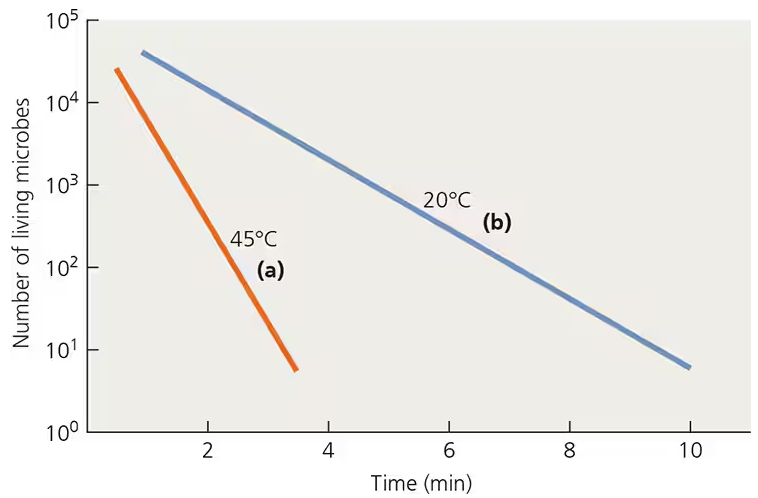
Calculate the decimal reduction time (D) for the two temperatures in the following graph.
Graph showing the decline in number of living microbes over time at 45°C and 20°C on a logarithmic scale.

Guida verificata passo dopo passo
1
Identify the decimal reduction time (D) definition: it is the time required at a certain temperature to reduce the number of living microbes by 90%, which corresponds to a 1-log reduction on a logarithmic scale.
On the graph, locate the initial number of living microbes for each temperature (45°C and 20°C) at the starting time point.
For each temperature, find the time it takes for the number of living microbes to decrease by one logarithmic unit (i.e., from 10^4 to 10^3, or from 10^3 to 10^2, etc.). This time interval corresponds to the decimal reduction time (D).
Calculate the difference in time between these two points on the x-axis (time in minutes) for each temperature curve. This difference is the decimal reduction time (D) for that temperature.
Repeat the process for both the 45°C and 20°C curves to find their respective D values, noting that the steeper slope (45°C) will have a smaller D value compared to the gentler slope (20°C).

Risposta video verificata per un problema simile:

Questa soluzione video è stata consigliata dai nostri tutor come utile per risolvere questo problema.
Durata del video:
1m

Concetti chiave

Ecco i concetti essenziali che devi comprendere per rispondere correttamente alla domanda.

Decimal Reduction Time (D-value)

The decimal reduction time (D-value) is the time required at a specific temperature to reduce the microbial population by 90%, or one log cycle. It is a key measure of microbial resistance to heat and is used to compare the effectiveness of different temperatures in killing microbes.
Video consigliato:
05:48
Calculating Generation Times

Logarithmic Scale in Microbial Death Curves

Microbial death over time is often plotted on a logarithmic scale to linearize the exponential decline in the number of living microbes. This allows easier calculation of the D-value by measuring the time interval for a one-log reduction in microbial count.
Video consigliato:
08:59
Microbial Growth Curves in a Closed System

Effect of Temperature on Microbial Death Rate

Higher temperatures generally increase the rate of microbial death, resulting in a shorter D-value. The graph shows two temperatures (20°C and 45°C), illustrating that microbes die faster at 45°C compared to 20°C, which is reflected in the steeper slope of the 45°C line.
Video consigliato:
04:16
Temperature Requirements for Microbial Growth