Ch. 13 - Alcohols, Ethers and Related Compounds: Substitution and Elimination
Mullins - Organic Chemistry: A Learner Centered Approach 1st Edition
Mullins1st EditionOrganic Chemistry: A Learner Centered ApproachISBN: 9780137566471Non è quello che usi tu?Cambia libro di testo
Capitolo 12, Problema 45

Show a reaction coordinate diagram for the two processes in Figure 13.41 that rationalizes pathway B as the one that gives the major product.
<IMAGE>

Guida verificata passo dopo passo
1
Step 1: Analyze the reaction coordinate diagram conceptually. A reaction coordinate diagram plots the energy of the system versus the progress of the reaction. It shows the relative energy levels of reactants, intermediates, transition states, and products.
Step 2: Compare the stability of intermediates in Pathway A and Pathway B. Pathway A involves the formation of a secondary carbocation, which is less stable due to fewer alkyl groups stabilizing the positive charge. Pathway B forms a tertiary carbocation, which is more stable because it is stabilized by three alkyl groups through hyperconjugation and inductive effects.
Step 3: Rationalize the energy differences. The tertiary carbocation in Pathway B will have a lower energy compared to the secondary carbocation in Pathway A. This difference in stability will be reflected in the reaction coordinate diagram, where the intermediate for Pathway B will be at a lower energy level than the intermediate for Pathway A.
Step 4: Consider the transition states. The transition state leading to the tertiary carbocation in Pathway B will also be lower in energy compared to the transition state leading to the secondary carbocation in Pathway A. This is because the pathway to a more stable intermediate generally has a lower activation energy.
Step 5: Draw the reaction coordinate diagram. Represent Pathway A with a higher energy intermediate and transition state, and Pathway B with a lower energy intermediate and transition state. Ensure the final product of Pathway B is at a lower energy level than the product of Pathway A, rationalizing why Pathway B is favored.

Risposta video verificata per un problema simile:

Questa soluzione video è stata consigliata dai nostri tutor come utile per risolvere questo problema.
Durata del video:
8m

Concetti chiave

Ecco i concetti essenziali che devi comprendere per rispondere correttamente alla domanda.

Reaction Coordinate Diagram

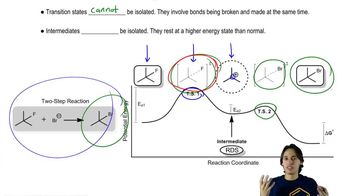
A reaction coordinate diagram is a graphical representation that illustrates the energy changes during a chemical reaction as it progresses from reactants to products. It typically shows the energy of the system on the y-axis and the reaction progress on the x-axis, highlighting transition states and intermediates. This diagram helps visualize the energy barriers and the stability of different species involved in the reaction.
Video consigliato:
05:02
Coordination Complexes

Transition State Theory

Transition state theory posits that during a chemical reaction, reactants must pass through a high-energy transition state before forming products. This theory explains the concept of activation energy, which is the energy required to reach the transition state. Understanding the transition states involved in different pathways allows chemists to predict which pathway is more favorable and likely to produce the major product.
Video consigliato:
06:55
Intermediates vs. Transition States

Reaction Mechanism

A reaction mechanism is a detailed step-by-step description of the process by which reactants are converted into products. It includes the identification of intermediates, transition states, and the sequence of elementary steps involved. Analyzing the mechanism helps in understanding why one pathway may lead to a major product over another, as it reveals the relative stability and energy of the intermediates and transition states.
Video consigliato:
02:16
Heck Reaction Mechanism