Ch. 3 - Alkanes and Cycloalkanes: Properties and Conformational Analysis
Mullins - Organic Chemistry: A Learner Centered Approach 1st Edition
Mullins1st EditionOrganic Chemistry: A Learner Centered ApproachISBN: 9780137566471Non è quello che usi tu?Cambia libro di testo
Capitolo 2, Problema 69

In Chapter 5, we introduce reaction coordinate diagrams as a plot of potential energy versus the progress of a reaction. Consider the reaction coordinate diagram drawn for the 'reaction' of conformation A becoming conformation B. Which structure is present at the top of the hill?
<IMAGE>

Guida verificata passo dopo passo
1
Step 1: Understand the reaction coordinate diagram. The diagram plots potential energy (E) versus reaction progress. The starting point (A) represents the initial conformation, and the endpoint (B) represents the final conformation.
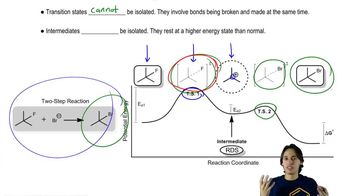
Step 2: Identify the 'hill' in the diagram. The peak of the hill corresponds to the highest energy point in the reaction pathway, known as the transition state.
Step 3: Recognize that the transition state is a structure that exists temporarily during the conversion of conformation A to conformation B. It is neither A nor B but an intermediate structure with partial characteristics of both.
Step 4: Analyze the chemical structures provided. The transition state likely involves a momentary arrangement where bonds or angles are strained as the molecule moves from conformation A to conformation B.
Step 5: Conclude that the structure at the top of the hill is the transition state, which represents the highest energy configuration during the reaction process.

Risposta video verificata per un problema simile:

Questa soluzione video è stata consigliata dai nostri tutor come utile per risolvere questo problema.
Durata del video:
1m

Concetti chiave

Ecco i concetti essenziali che devi comprendere per rispondere correttamente alla domanda.

Reaction Coordinate Diagrams

Reaction coordinate diagrams visually represent the energy changes during a chemical reaction. The x-axis typically shows the progress of the reaction, while the y-axis indicates the potential energy. These diagrams help illustrate the transition states and intermediates, allowing for a better understanding of the energy barriers that must be overcome for a reaction to proceed.
Video consigliato:
05:02
Coordination Complexes

Transition State

The transition state is a high-energy, unstable arrangement of atoms that occurs during the transformation from reactants to products. It represents the point of maximum energy along the reaction pathway, often depicted at the peak of the hill in a reaction coordinate diagram. Understanding the transition state is crucial for predicting reaction rates and mechanisms.
Video consigliato:
06:55
Intermediates vs. Transition States

Conformational Analysis

Conformational analysis involves studying the different spatial arrangements of a molecule that can result from rotation around single bonds. In the context of the question, it refers to the comparison between conformations A and B, where the energy difference between these states can be visualized in the reaction coordinate diagram. This analysis helps in understanding the stability and reactivity of different conformations.
Video consigliato:
03:29
Understanding what a conformer is.
Pratica correlata
Domanda del libro di testo

Correct the following incorrect names using standard IUPAC nomenclature. [Draw a compound that corresponds to the incorrect name, and then rename it.]

(c) 6-ethyl-3-methyloctane

1475
views

Domanda del libro di testo

Correct the following incorrect names using standard IUPAC nomenclature. [Draw a compound that corresponds to the incorrect name, and then rename it.]

(a) 4-methylhexane

1014
views
Domanda del libro di testo

In contrast to ethane and other alkanes studied in this chapter, there is no free rotation around any bonds in cyclopentane (shown below). Why?

1117
views
Domanda del libro di testo

Looking ahead In Chapter 5, we explain that the equilibrium constant (Keq) for a reaction can be calculated based on the difference in energy between reactants and products, according to the following equation:

Keq=e−ΔERTK_{eq}=e^{-\(\frac{\Delta E}{RT}\)}

Using this equation, calculate the equilibrium constant for the 'reaction' shown. [For the rest of the book, if not otherwise specified, assume room temperature (298K).]

1295
views
1
rank
Domanda del libro di testo

Correct the following incorrect names using standard IUPAC nomenclature. [Draw a compound that corresponds to the incorrect name, and then rename it.]

(b) 1,5-dimethylcyclohexane

1128
views
Domanda del libro di testo

The normal C(sp3)–C(sp3) bond length is 1.54 Å. The normal bond angle for an sp3-hybridized carbon is 109.5°. The following molecule experiences large deviations from these normal values. Explain these deviations. [Molecular models would be helpful here.]

1001
views